
UNITED STATES
SECURITIES AND EXCHANGE COMMISSION
WASHINGTON, DC 20549
FORM
(Mark One)
ANNUAL REPORT PURSUANT TO SECTION 13 OR 15(d) OF THE SECURITIES EXCHANGE ACT OF 1934 |
For the fiscal year ended
OR
TRANSITION REPORT PURSUANT TO SECTION 13 OR 15(d) OF THE SECURITIES EXCHANGE ACT OF 1934 |
For the transition period from to .
Commission file number
(Exact Name of Registrant as Specified in Its Charter)
______________________________________________
|
||
(State or Other Jurisdiction of |
|
(I.R.S. Employer |
(Address of Principal Executive Offices) (Zip Code) |
( |
(Registrant’s Telephone Number, Including Area Code) |
Securities registered pursuant to Section 12(b) of the Act: |
||||
|
|
|
|
|
Title of Each Class |
|
Trading Symbol |
|
Name of Each Exchange on Which Registered |
|
|
|||
|
|
|||
Securities registered pursuant to Section 12(g) of the Act:
None
Indicate by check mark if the registrant is a well-known seasoned issuer, as defined in Rule 405 of the Securities Act.
Indicate by check mark if the registrant is not required to file reports pursuant to Section 13 or Section 15(d) of the Act. Yes
Indicate by check mark whether the registrant (1) has filed all reports required to be filed by Section 13 or 15(d) of the Securities Exchange Act of 1934 during the preceding 12 months (or for such shorter period that the registrant was required to file such reports), and (2) has been subject to such filing requirements for the past 90 days.
Indicate by check mark whether the registrant has submitted electronically every Interactive Data File required to be submitted pursuant to Rule 405 of Regulation S-T (§ 232.405 of this chapter) during the preceding 12 months (or for such shorter period that the registrant was required to submit such files).
Indicate by check mark whether the registrant is a large accelerated filer, an accelerated filer, a non-accelerated filer, smaller reporting company or an emerging growth company. See the definitions of “large accelerated filer,” “accelerated filer,” “smaller reporting company,” and “emerging growth company” in Rule 12b-2 of the Exchange Act.
|
|
Accelerated filer |
|
|
Non-accelerated filer |
|
|
Smaller reporting company |
|
|
|
|
Emerging growth company |
If an emerging growth company, indicate by check mark if the registrant has elected not to use the extended transition period for complying with any new or revised financial accounting standards provided pursuant to Section 13(a) of the Exchange Act.
Indicate by check mark whether the registrant has filed a report on and attestation to its management’s assessment of the effectiveness of its internal control over financial reporting under Section 404(b) of the Sarbanes-Oxley Act (15 U.S.C. 7262(b)) by the registered public accounting firm that prepared or issued its audit report.
If securities are registered pursuant to Section 12(b) of the Act, indicate by check mark whether the financial statements of the registrant included in the filing reflect the correction of an error to previously issued financial statements.
Indicate by check mark whether any of those error corrections are restatements that required a recovery analysis of incentive-based compensation received by any of the registrant’s executive officers during the relevant recovery period pursuant to §240.10D-1(b). ☐
Indicate by check mark whether the registrant is a shell company (as defined in Rule 12b-2 of the Act). Yes ☐ No
As of June 30, 2024, the last business day of the registrant's most recently completed second quarter, the aggregate market value of the registrant's common stock held by non-affiliates of the registrant was $
As of February 24, 2025, the registrant had
Documents Incorporated by Reference
Portions of the registrant’s definitive proxy statement for its 2025 Annual Meeting of Stockholders are incorporated by reference in Part III of this Annual Report on Form 10-K. Such proxy statement will be filed with the Securities and Exchange Commission within 120 days of the registrant’s fiscal year ended December 31, 2024.
CAUTIONARY STATEMENT REGARDING FORWARD-LOOKING STATEMENTS
This Annual Report on Form 10-K contains “forward-looking statements,” as that term is defined under the Private Securities Litigation Reform Act of 1995 (“PSLRA”), Section 27A of the Securities Act of 1933, as amended (the “Securities Act”), and Section 21E of the Securities Exchange Act of 1934, as amended (the “Exchange Act”). Forward-looking statements include statements about our expectations, beliefs or intentions regarding our business, financial condition, results of operations, strategies or prospects. You can identify forward-looking statements by the fact that these statements do not relate strictly to historical or current matters. Rather, forward-looking statements relate to anticipated or expected events, activities, trends or results as of the date they are made. Because forward-looking statements relate to matters that have not yet occurred, these statements are inherently subject to risks and uncertainties that could cause our actual results to differ materially from any future results expressed or implied by the forward-looking statements. Many factors could cause our actual activities or results to differ materially from the activities and results anticipated in forward-looking statements. These factors include those described in “Item 1A-Risk Factors” of this Annual Report on Form 10-K. We do not undertake any obligation to update forward-looking statements, except to the extent required by applicable law. We intend that all forward-looking statements be subject to the safe-harbor provisions of the PSLRA. These forward-looking statements are only predictions and reflect our views as of the date they are made with respect to future events and financial performance.
Risks and uncertainties, the occurrence of which could adversely affect our business, include the following:
Table of Contents
|
|
Page |
|
|
|
Item 1. |
1 |
|
Item 1A. |
Risk Factors |
8 |
Item 1B. |
18 |
|
Item 1C. |
18 |
|
Item 2. |
19 |
|
Item 3. |
19 |
|
Item 4. |
19 |
|
|
|
|
|
|
|
Item 5. |
20 |
|
Item 6. |
[Reserved.] |
|
Item 7. |
Management’s Discussion and Analysis of Financial Condition and Results of Operations |
22 |
Item 7A. |
39 |
|
Item 8. |
40 |
|
Item 9. |
Changes in and Disagreements With Accountants on Accounting and Financial Disclosure |
41 |
Item 9A. |
41 |
|
Item 9B. |
41 |
|
Item 9C. |
Disclosure Regarding Foreign Jurisdictions that Prevent Inspections |
41 |
|
|
|
|
|
|
Item 10. |
42 |
|
Item 11. |
42 |
|
Item 12. |
Security Ownership of Certain Beneficial Owners and Management and Related Stockholder Matters |
42 |
Item 13. |
Certain Relationships and Related Transactions, and Director Independence |
42 |
Item 14. |
42 |
|
|
|
|
|
|
|
Item 15. |
43 |
|
Item 16. |
46 |
i
PART I
Unless the context otherwise requires, all references in this Annual Report on Form 10-K to the “Company,” “ARKO,” “we,” “our,” “ours,” and “us” refer to ARKO Corp., a Delaware corporation, including our consolidated subsidiaries.
ITEM 1. BUSINESS
Overview
Based in Richmond, VA, ARKO Corp. is a leading independent convenience store operator and one of the largest convenience store chains in the United States (“U.S.”) ranked by store count.
As of December 31, 2024, we operated 1,389 retail convenience stores under more than 25 regional store brands that have been in existence for an average of approximately 50 years, which we consider “a Family of Community Brands.” While maintaining multiple established store brand names, our stores derive significant value from the scale, corporate infrastructure and centralized marketing programs associated with our large network, including a common operating platform and a loyalty program network that we use as a platform for promotions and marketing initiatives throughout our convenience stores.
As of December 31, 2024, we supplied fuel to 1,922 dealer locations. Additionally, we operate a fleet fueling business that included, as of December 31, 2024, the operation of 280 proprietary and third-party cardlock locations (unstaffed fueling locations) and the issuance of proprietary fuel cards that provide customers access to a nationwide network of fueling sites.
We are diversified geographically and, as of December 31, 2024, operated in the District of Columbia and in more than 30 states in the Mid-Atlantic, Midwestern, Northeastern, Southeastern and Southwestern U.S.
We have achieved strong site count growth over the last decade, primarily by implementing a highly successful acquisition strategy. From 2013 through 2024, we completed 26 acquisitions, and our site count has grown from 320 sites in 2011 to 3,591 sites as of December 31, 2024. We have traditionally acquired our stores in smaller towns that have lower concentrations of national-chain convenience stores. Approximately 46% of our retail stores are in cities with populations of fewer than 20,000 people, and approximately 17% of our retail stores are in cities with populations between 20,000 and 50,000 people. We believe that our focus on secondary and tertiary markets allows us to preserve “local” brand name recognition.
During 2024, we commenced development and initial implementation of a multi-year transformation plan (the “Transformation Plan”). As part of this plan, we converted a significant number of retail stores throughout our chain to dealer sites, and we are in the process of converting a significant number of additional retail stores to dealer sites, leveraging the fact that we are also a leading wholesale distributor of motor fuel. Such conversions will enable us to focus the investment elements of our Transformation Plan in a more select group of stores that we believe will create a strong platform for future growth within the highly fragmented and competitive convenience store industry.
Corporate Information
ARKO Corp. was incorporated under the laws of Delaware on August 26, 2020 for the purpose of facilitating the business combination of Haymaker Acquisition Corp. II, a Delaware corporation, and ARKO Holdings Ltd., a company organized under the laws of the State of Israel. Our shares of common stock, $0.0001 par value per share (“common stock”), and publicly-traded warrants are listed on the Nasdaq Stock Market under the symbols “ARKO” and “ARKOW,” respectively.
We own, indirectly, 100% of GPM Investments, LLC, a Delaware limited liability company that was formed on June 12, 2002, which we refer to as GPM, and which is our primary operating entity.
Our Business Segments
Retail Segment
Our retail segment includes the operation of a chain of retail stores, which includes convenience stores selling fuel products and merchandise to retail customers, from which we generate a significant portion of our revenue and large proportion of our profitability. We focus our marketing and merchandising initiatives at our retail stores on offering our customers an assortment of products with an attractive value proposition. Our store offering includes a wide array of cold and hot foodservice, beverages, cigarettes and other tobacco products, candy, salty snacks, grocery, beer and general merchandise. We have foodservice offerings at approximately 1,185 stores, which include hot and fresh grab-n-go foods, deli, fried chicken, bakery, pizza, roller grill items and other prepared foods. We supplement our foodservice offering with approximately 110 quick service major national brand restaurants. Relevant and delicious food offerings are a key strategic priority for our retail segment, and as part of our Transformation Plan, we
1
expect to maintain a significant focus on frozen grab-n-go and enhanced hot food capabilities. Additionally, we provide a number of traditional convenience store services, including lottery, prepaid products, gift cards, money orders, ATMs, gaming, and other ancillary product and service offerings. Almost all stores sell fuel, and we had 111 electric vehicle (“EV”) chargers at 38 stores across 13 states as of December 31, 2024. We also generate revenues from car washes at approximately 75 of our locations.
We operate our stores under more than 25 regional store brands (which we consider “a Family of Community Brands”), including 1-Stop, Admiral, Apple Market®, BreadBox, Corner Mart, Dixie Mart, ExpressStop®, E-Z Mart®, fas mart®, fastmarket®, Flash Market, Handy Mart, Jetz, Jiffi Stop®, Jiffy Stop, Li’l Cricket, Market Express, Next Door Store®, Pride, Roadrunner Markets, Rose Mart, Rstore, Scotchman®, shore stop®, Speedy’s, SpeedyQ, Town Star, Uncle’s, Village Pantry® and Young’s.
Our brands have been in existence for an average of approximately 50 years, and their names are highly recognizable to local customers. By maintaining the regional store branding of our stores, we believe we retain the goodwill associated with the respective brands’ long-term community involvement. Concurrently, our Family of Community Brands benefits significantly from being part of a leading convenience store operator given their access to:
For the year ended December 31, 2024, the retail segment generated total revenues of approximately $5.3 billion, including approximately $1.8 billion of in-store sales and other revenues. Gross profit dollars from in-store merchandise accounted for 54.0% of our gross profit dollars from our retail segment for the year ended December 31, 2024. In addition, the retail segment sold approximately 1.1 billion gallons of branded and unbranded fuel to our retail customers.
Wholesale Segment
The wholesale segment supplies fuel to dealers, sub-wholesalers and bulk and spot purchasers, on either a consignment or cost plus basis.
The wholesale segment adds significant fuel volumes to the Company’s robust retail fuel sales, which we believe enhances our purchasing power for our entire platform, including our retail segment, and improves our competitiveness as an acquirer of choice. In 2024, as part of our Transformation Plan, we utilized our wholesale platform to convert retail sites that we believe will provide more economic benefit as dealer sites leased from us and supplied through our fuel agreements, and in certain cases, providing benefits under our vendor agreements.
For the year ended December 31, 2024, the wholesale segment sold 949.4 million gallons of fuel (approximately 43.4% of our total gallons sold in 2024), generating revenues of approximately $2.8 billion.
Fleet Fueling Segment
We added our fleet fueling segment as part of our acquisition of certain assets from Quarles Petroleum, Incorporated (“Quarles”) in July 2022 that included 184 cardlock locations, and we added an additional 111 cardlock locations in our 2023
2
acquisition of the GASCARD fleet fueling operations of WTG Fuels Holdings, LLC (the “WTG Acquisition”), one of the largest fleet fueling operations in West Texas. The fleet fueling segment includes the operation of proprietary and third-party cardlock locations (unstaffed fueling locations) with sales to commercial and municipal entities, and commissions from the sale of fuel using proprietary fuel cards that provide customers access to a nationwide network of fueling sites. Diesel fuel currently accounts for approximately 80% of our fleet fueling sales. Fleet fueling complements our retail and wholesale segments, from which we believe we can grow and expand our fleet fueling segment. Commercial companies using the Quarles fleet cards have gradually shifted from the proprietary fleet card useable only at Quarles-branded locations to the “Universal” fleet card which is a cobranded with Voyager (U.S. Bank) and which can be used at more than 230,000 fueling sites.
For the year ended December 31, 2024, the fleet fueling segment sold 148.9 million gallons of fuel, generating revenues of approximately $524.6 million.
GPMP Segment
The GPMP segment engages in the wholesale distribution of fuel to substantially all of our sites that sell fuel in the retail and wholesale segments. GPM Petroleum LP (“GPMP”) sells fuel at GPMP’s cost of fuel (including taxes and transportation) plus a fixed margin and charges a fixed fee primarily to sites in the fleet fueling segment that are not supplied by GPMP. We own 100% of the general partner of GPMP and 100% of the GPMP limited partner units.
Growth Strategy
We believe that we have a significant opportunity to increase our sales and profitability by continuing to execute on our organic and inorganic strategies described below.
Organic Growth Opportunities
Our organic strategies are focused on improving the performance of our retail stores through enhanced marketing and merchandising initiatives across our brands, such as our loyalty program, which deepens our relationship with our customers, implementing a multi-year transformation plan with the goal of enhancing our existing retail store base and expanding our foodservice offering to meet our customers’ needs.
Enhanced Marketing and Merchandising Initiatives
Remodels and New-to-Industry (“NTI”)
In 2024, we expanded our pipeline of NTI stores to eight NTI stores, out of which we opened one NTI HandyMart location and a new Dunkin’ store in 2024 and in the first quarter of 2025, we opened a new Dunkin’ store and a fastmarket® location, with the balance of the pipeline to be opened over the course of 2025. In 2023, we opened three new Dunkin’ stores and a new Pride location. In the past two years, we continued to upgrade existing stores through functional remodels, such as adding bean-to-cup coffee offerings, roller grills, enhanced dispensed beverage offerings and our successful grab-n-go and freezer strategy.
Multi-Year Transformation Plan
We are currently continuing to develop and implement our Transformation Plan, which includes the following elements, among others:
3
Inorganic Growth Opportunities
We have a dedicated in-house M&A team that focuses on identifying, closing and integrating acquisitions. As an experienced acquirer, we have demonstrated our ability to generate strong returns on capital and meaningfully improve target performance post-integration through operating expertise and economies of scale. We believe that our business model provides us with strategic flexibility to acquire chains with retail, dealer and cardlock locations. We believe that our scale has enabled us to become a formidable industry player, enhanced our competitiveness, and positioned us as an acquirer of choice within the industry. As a “super-jobber” wholesaler, we believe we are better positioned to gain and renew supply contracts from dealers in addition to convenience store and wholesale fuel portfolios, and we incentivize our wholesale sales staff based on renewals. Additionally, we believe we can grow and expand the Company’s fleet fueling platform through further acquisitions, including in conjunction with our retail and wholesale acquisitions.
Additionally, as part of our post-acquisition process following the integration of our systems, we implement our store planograms and merchandise assortment in newly acquired stores and expand category footages where necessary in order to improve the performance of acquired stores. We believe our significant size and scale aids our efforts to successfully deploy our organic growth strategies in our acquired assets, which we anticipate will result in value accretion.
Suppliers
In 2024, we purchased merchandise inventory from one primary wholesale distributor, Core-Mark, as well as approximately 870 direct store delivery supplier distributors. We leverage our relationships to generate economies of scale across our store base.
We purchase motor fuel primarily from large, integrated oil companies and independent refiners under supply agreements. In addition, we purchase unbranded fuel from branded and unbranded fuel suppliers to supply 246 unbranded retail fueling locations and 280 cardlock locations. As of December 31, 2024, approximately 82% of our retail fuel locations sold branded fuel. We sell branded fuel under brand names including, among others, Valero®, Marathon®, BP®, Exxon® and Shell® brand names. In addition to driving customer traffic, we believe that our branded fuel strategy enables us to maintain a secure fuel supply.
Competition
We operate in the highly competitive retail convenience market, which includes businesses with operations and services that are similar to those that we provide, primarily the sale of convenience items and motor fuels. We face significant competition from other large chain operators, such as 7-Eleven/Speedway; Circle K; Casey’s; Murphy USA; Quik Trip; Royal Farms; Sheetz; and
4
Wawa, many of which are building NTI sites in our markets. We believe that convenience stores managed by individual operators who offer branded or non-branded fuel are also significant competitors in the local markets in which we operate. Often, operators of both chains and individual stores compete by selling unbranded fuel at lower retail prices relative to the market. We believe that the primary competitive factors influencing the retail segment are: site location; the number of sites in an area; competitive prices; convenient access routes; the quality and configuration of the store and the fueling facility; the range of high-quality products and services offered; a convenient store-front; cleanliness; branded fuel; and the degree of capital investment in the store. In developing our Transformation Plan, our goal is to better position ARKO to face growing competition.
The convenience store industry experiences competition from other retail sectors, including grocery stores, large warehouse retail stores, dollar stores and pharmacies. In particular, dollar stores (such as Family Dollar and Dollar General) and pharmacies (such as CVS and Walgreens) now sell snacks, beer and wine and other products that have traditionally been sold by convenience stores, while grocery and large warehouse stores (such as Costco and Wal-Mart) sell fuel adjacent to their stores. In smaller towns and more rural areas, we primarily compete with other local convenience stores, local or regional grocery stores, and to some extent, restaurants, and in more heavily populated areas, we often compete with local retailers as well as major national grocery chains, national drug store and warehouse retail stores brands like those mentioned above, traditional convenience stores, expanded fuel stations, and discount food retailers.
The wholesale business is also competitive. In the wholesale segment, we supply fuel to third-parties both at sites owned or leased by dealers, sites that we own or for which we have a long-term lease, and bulk and spot purchasers. For sites that we do not own or lease, in the renewal of contracts, we compete with refiners that distribute their own products, as well as other independent third-party motor fuel distributors.
In order to mitigate this competition, we typically offer our dealers competitive pricing within the framework of our existing fuel supply agreements, such as those we have with Valero, BP, Shell, Motiva, Marathon and ExxonMobil, with the advantage that we distribute fuel sourced from a number of major oil company suppliers which allows us to approach a wide variety of branded and unbranded dealers in order to offer a variety of alternative supply arrangements. Wholesale fuel distributors typically compete by offering lesser collateral requirements and larger incentives and/or rebates to enter into contracts. We believe we have competitive arrangements with respect to fuel equipment, which provides an advantage when negotiating contracts with equipment suppliers by allowing us to be more competitive on upfront investments at sites.
Cardlocks compete against retail gas stations, especially those with a significant number of diesel pumps, however, we believe that our cardlock footprint allows for easier access and more efficient fueling for commercial vehicles than traditional retail fueling locations. Site growth in the fleet fueling segment is driven by commercial customers outsourcing the provision of on-site fleet fueling. The primary competitors for third-party sites are companies that provide delivered fuels, with national, regional and local companies offering this service. We believe that we are well positioned in the industry because we combine the ability to utilize our proprietary cardlock sites with our fleet card product sales.
We believe that the primary barriers to entering our industry are the significant financial strength required to enter into agreements with suppliers of fuel products and competition from other fuel companies and retail chains.
Environmental and Other Government Regulations
Our operations are subject to numerous legal and regulatory restrictions and requirements at the federal, state and local levels. With regard to fuel, these restrictions and requirements relate primarily to the transportation, storage, and sale of petroleum products, including stringent environmental protection requirements. In our wholesale and GPMP segments, we are also subject to the Petroleum Marketing Practices Act, which is a federal law that applies to the relationships between fuel suppliers and wholesale distributors, as well as between wholesale distributors and dealers, regarding the marketing of branded fuel.
With regard to non-fuel products, there are legal restrictions at the federal, state and local levels in connection with the sale of food, alcohol, cigarettes and other tobacco products, lottery, ephedrine, menu labeling, video retention, money orders, money transfer services, gaming, pricing, rebates and incentives. Also, regulatory supervision is exercised by health departments at the federal, state and local levels over the food products that are sold in our stores.
With respect to data collected by us or on our behalf, including credit card information and data related to loyalty customers, we are subject to federal, state and local requirements related to the possession, use and disclosure of personally identifiable information, including mandated procedures to be followed in the event a data breach were to occur.
5
We hold various federal, state, and local licenses and permits, some of which are perpetual, but most of which must be renewed annually. These include general business licenses, lottery licenses, licenses and permits in connection with the sale of cigarettes, licenses in connection with the operation of gaming machines, licenses in connection with the sale of alcoholic drinks, licenses and permits that are required in connection with the sale of fuel, licenses that are required for the operation of convenience stores and licenses to sell food products.
Our operations are subject to federal and state laws governing such matters as minimum wage, overtime, rest breaks, working conditions and employment eligibility requirements. New and proposed regulations at local, state and federal levels have affected minimum wage rates, paid time-off and paid sick leave.
With respect to environmental regulations, we are subject to a comprehensive framework of local, state and federal environmental laws and regulations governing our properties and operations, including, but not limited to, the transportation, storage and sale of fuel. These regulations significantly impact on our operations and necessitate strict adherence to the requirements set forth by the U.S. Environmental Protection Agency (“EPA”) and comparable state agencies. Key applicable statutes include the Comprehensive Environmental Response, Compensation, and Liability Act; the Resource Conservation and Recovery Act; the Clean Air Act; the Occupational Safety and Health Act; the Hazardous Materials Transportation Act; and the Energy Policy and Conservation Act. Compliance with these laws is essential to our commitment to environmental stewardship and operational integrity.
The EPA and several states regulate the ownership and operation of underground fuel storage tanks (“USTs”), the release of hazardous substances into the air, water and land, the storage, handling disposal and transportation of hazardous materials, restrictions on exposure to hazardous substances and maintaining safety and health of employees who handle or are exposed to such substances. These regulations require UST owners to demonstrate that they have the financial capacity to pay for environmental cleanup associating with USTs. Several states in which we conduct business have state-sponsored trust fund programs that allow for the sharing and reimbursement of the costs of corrective measures incurred by UST owners. In addition, we are subject to regulations regarding fuel quality and air emissions.
We are committed to compliance with all applicable environmental laws and regulations. We allocate a portion of our capital expenditure program to compliance with environmental laws and regulations and environmental remediation and such capital expenditures were approximately $3.5 million for the year ended December 31, 2024, and we anticipate expenditures of approximately $2.6 million for the year ending December 31, 2025. Our environmental department maintains direct interaction with federal, state and local environmental agencies across all jurisdictions in which we operate so that we remain informed of regulatory developments and to promote compliance with evolving environmental standards. As part of our environmental risk management process, we engage qualified environmental consultants and service providers. These experts assist in analyzing our exposure to environmental risks, developing remediation plans, and implementing corrective actions as necessary. We believe this collaborative approach effectively manages potential environmental liabilities while upholding our commitment to sustainability.
Human Capital
As of December 31, 2024, we employed 11,772 employees, with 10,328 employed in our stores and 1,444 in corporate and field management positions. To build, and continually improve upon, our corporate culture, we emphasize core values such as integrity, teamwork, and customer focus communicated through various channels such as training programs, internal communications, and employee feedback.
We value our employees and believe that communication, training, and employee development are key elements of our performance. We feel that improving the skills of our current staff through training increases productivity and boosts our bottom line at a fraction of the cost of hiring new employees. We offer training based on our employees’ specific job requirements and employee levels using our Learning Management System (LMS) designed for delivering online training modules. These include, but are not limited to, a series of short online modules that are completed upon hire and some that are repeated annually to promote consistent compliance. Additionally, our store managers or our Regional Training team conduct on-the-job training activities that we have developed. We continue to refine these training activities, add new training programs for store and district managers, and focus on leadership and other “soft skills.” Our Regional Training team conducts the Company and industry-specific training to ensure store management is well-versed in the latest operating policies, standards, and techniques. Training varies based on employee level, but generally focuses on customer service, safety, compliance, environmental issues, and regulations, as well as our operations and policies. We help identify clear career paths to retain current employees and attract new employees by encouraging them to grow with the Company through educational training programs, matching employees with their interests or identifying a career trajectory other employees have taken.
Our experienced store managers and our regional trainers conduct the training of store managers from acquired sites in a classroom setting pre- and post-acquisition, as well as on-the-job training that extends several weeks once the acquisition is complete.
6
We have communication vehicles allowing us to send company information and reminders to targeted levels of employees, to keep them informed and improve efficiency, particularly during key times throughout the year such as the 100 days of summer. Employees may also communicate anonymous feedback to the Company, which assists our efforts to improve processes and programs for future and existing employees.
We seek to recruit and retain qualified personnel to work in our stores. Wage rates in the markets in which we operate, including voluntary increases in wages because of current labor market conditions, have increased our costs associated with recruiting and retaining qualified personnel, and expect to continue to do so in the future. We look to promote employee retention by providing employee benefits such as medical, dental, 401(k) retirement plan and insurance. We believe our benefits offerings are competitive in the markets in which we operate.
We evaluate wages and other opportunities available to employees within our markets, and, as applicable, grant sign-on, retention, referral and other bonus opportunities to our employees based on their respective roles. By researching and understanding hiring trends, we have adopted mobile technology to simplify the application process and we have invested in additional recruiting resources and implemented virtual recruiting and interviewing methods. We have also deployed enhanced recruiting techniques to optimize the selection of our talent pool. As of December 31, 2024, none of our employees were represented by a labor union or have terms of employment that are subject to a collective bargaining agreement. We consider our relationships with our employees to be good and have not experienced any work stoppages.
Intellectual Property
We rely on trademarks that we own and trademarks we license from third-parties to protect our brands and identify the source of our goods and services. We have registered or applied to register many of our trademarks with the United States Patent and Trademark Office. We license various marks in relation to the branded fuels that we supply, including “ExxonMobil,” “Marathon,” “BP,” “Shell,” and “Valero.” In our quick service food offerings, we license trademarks such as “Subway” and “Dunkin’” to use at our applicable franchised or licensed outlets. We also license the “Jetz” trademark for use at certain of our convenience stores in Wisconsin.
We rely on other forms of intellectual property to help establish and maintain our competitive advantage, including proprietary software, trade secrets and other proprietary and confidential information. We receive confidential information from our franchise and fuel supply partners, and use it in the operation of our stores under agreements that we have with our partners. We also rely on our own proprietary and confidential information, including trade secrets and a limited amount of proprietary software, to conduct our business and preserve our position in the market. As a key part of our broader risk management strategy, we use access controls and contractual restrictions in an effort to prevent unauthorized use or disclosure of our proprietary or confidential information.
Environmental, Social and Governance
As a leading operator of convenience stores and gas stations, we are focused on integrating Environmental, Social and Governance principles that are aligned with our long-term business strategy. Annually, we issue a Sustainability Report which includes a description of our governance framework, environmental initiatives and social responsibility initiatives. Our 2024 Sustainability Report issued in July 2024 is available on our website at www.arkocorp.com. The information related to Environmental, Social and Governance on our website, including our Sustainability Report, is not, and shall not be deemed to be, a part hereof or incorporated by reference into this or any of our other filings with the U.S. Securities and Exchange Commission (“SEC”).
Available Information
We are required to file annual, quarterly and current reports, proxy statements and other information with the SEC. Information that we file with the SEC is available at the SEC’s website at www.sec.gov. We also make available free of charge on or through our website, at www.arkocorp.com, our Annual Reports on Form 10-K, Quarterly Reports on Form 10-Q, Current Reports on Form 8-K and all amendments to those reports as soon as reasonably practicable after such material is electronically filed with the SEC. The information on our website is not, and shall not be deemed to be, a part hereof or incorporated into this or any of our other filings with the SEC.
Use of our Website and Social Media to Distribute Material Company Information
We use our website as a channel of distribution for important Company information. We post on our website important information, including press releases, investor presentations and financial information, which may be accessed by clicking on the News & Events, Company Info, and Governance sections of www.arkocorp.com. We also use our website to expedite public access to
7
time-critical information regarding our Company in advance of, or in lieu of, distributing a press release or a filing with the SEC disclosing the same information. Therefore, investors should look to the News & Events, Company Info, and Governance sections of our website for important and time-critical information. Visitors to our website can also register to receive automatic e-mail and other notifications alerting them when certain new information is made available on our website. Information contained on, or accessible through, our website is not a part of and is not incorporated by reference into this Annual Report on Form 10-K.
We encourage investors, the media and other interested parties to review the information we post on our website, together with the information we file with the SEC and announce via press releases, conference calls and webcasts.
ITEM 1A. RISK FACTORS.
You should carefully consider the risks described below, as well as other information contained in this Annual Report on Form 10-K, including the audited consolidated financial statements contained in Part II, Item 8 of this Annual Report on Form 10-K (the “Consolidated Financial Statements”) and the notes thereto and “Management’s Discussion and Analysis of Financial Condition and Results of Operations.” The occurrence of any of the events discussed below could significantly and adversely affect our business, prospects, results of operations, financial condition, and cash flows.
Risks Related to Our Business and Industry
Changes in economic conditions, tax or trade policy, and consumer confidence in the U.S. could materially adversely affect our business.
Our operations and the scope of services we provide are affected by changes in the macro-economic situation in the United States, which has a direct impact on consumer confidence and spending patterns. A number of key macro-economic factors, such as interest rates, inflation and unemployment, could have a negative effect on consumer habits and spending, and lead to lower demand for fuel and other products sold at our convenience stores. The U.S. economy has continued to experience inflationary pressures, which reduce consumer purchasing power. If this trend continues or increases, it could negatively impact demand and seasonal travel patterns, which could reduce future sales volumes.
Any major changes in tax or trade policy between the U.S. and countries from which we or our suppliers source merchandise and other products for our sites, such as the imposition of additional tariffs or duties on imported products, could require us to take certain actions, including raising prices on products we sell and seeking alternative sources of supply. Any of these actions could adversely affect our reputation and results of operations.
Significant negative developments in the macro-economic environment in the United States could have a material adverse effect on our business, financial condition and results of operations.
If our acquisitions or divestitures are not on economically acceptable terms, or if our acquisitions do not perform as we expect, our future growth may be negatively impacted.
Our growth strategy includes the acquisition of other companies or assets that either complement or expand our existing businesses. The execution of our growth strategy also includes opportunistic divestitures. Any such acquisitions or divestitures will be subject to the negotiation of definitive agreements, applicable governmental approvals and consents, including under applicable antitrust laws, and, in certain instances, satisfactory financing arrangements. We cannot assure you that we will be able to identify suitable transactions and, even if we are able to identify such transactions, that we will be able to consummate any such transactions on economically acceptable terms. Any acquisitions or divestitures that we pursue may involve a number of risks, including some or all of the following:
8
There is intense competition for acquisition opportunities in our industry, and we may not be able to identify attractive acquisition opportunities. Competition for acquisitions may also increase the cost of, or cause us to refrain from, completing acquisitions. We may complete acquisitions, which, contrary to our expectations, ultimately do not prove to be accretive. If any of these events were to occur, our future growth may be negatively impacted. We also may not recognize the anticipated benefits, including operating advantages and cost savings, of divestitures that we pursue. If we do not realize the expected strategic, economic or other benefits of any divestiture or if we are unable to offset impacts from the loss of revenue associated with such divestiture, it could materially and adversely affect our business, cash flows, financial condition and results of operations.
We may be unable to successfully integrate acquired operations or otherwise realize the expected benefits from our acquisitions, which could adversely affect the expected benefits from our acquisitions and our results of operations and financial condition.
Any acquisition involves the integration of the business of two companies that have previously operated independently. The difficulties of combining the operations of the two businesses include: integrating personnel with diverse business backgrounds; familiarizing employees with new systems; converting customers to new loyalty platforms; and combining different corporate cultures.
The process of integrating operations could cause an interruption of, or loss of momentum in, the activities of the business, and the loss of key personnel or customers. The diversion of management’s attention and any delay or difficulty encountered in connection with the integration of the two companies’ operations could have an adverse effect on our business and results of operations.
The success of our acquisitions depends, in part, on our ability to realize the anticipated benefits from combining the acquired business with ours. If we are unable to successfully integrate an acquired business, the anticipated benefits of such acquisition may not be realized fully or may take longer to realize than expected which could have a material adverse effect on our business, financial condition and results of operations. For example, we may fail to realize the anticipated increase in earnings anticipated to be derived from an acquisition or the synergies expected, or there could be higher expenses related to the acquired business than expected. In addition, as with any acquisition, a significant decline in asset valuations or cash flows may also cause us not to realize expected benefits.
If our conversion of certain retail stores within our retail segment to dealer sites within our wholesale segment does not result in the anticipated benefits of such conversion, then our growth may be negatively impacted and could adversely affect our results of operations and financial condition.
A part of our Transformation Plan includes the conversion of a meaningful number of retail stores within our retail segment to dealer sites within our wholesale segment. The success of these conversions depends, in part, on our ability to realize the anticipated benefits from the related new dealer fuel supply contracts. If the terms of the new fuel supply contracts are not as favorable as we had anticipated, the anticipated benefits of such conversions may not be realized fully, if at all, or may take longer to realize than expected which could have a material adverse effect on our business, financial condition and results of operations. Additionally, we may lose certain economies of scale with respect to our purchasing power that are provided by the current scope of our retail operations.
Our future growth depends on our ability to successfully implement our growth strategies, a part of which consists of upgrading and remodeling our convenience stores and constructing NTI stores.
A part of our growth strategy consists of functional and full remodeling of our convenience stores, as well as building new convenience stores. Such upgrades, remodeling and building projects, regardless of scale, entail significant risks, including development, conceptual and timing risks. Specifically, with the execution of remodeling and building strategies, risks include shortages of materials and skilled labor, environmental or geological problems, work stoppages, weather interference, unanticipated cost increases and non-availability of construction equipment. Such risks, in addition to potential difficulties in obtaining any required licenses and permits, could lead to significant cost increases and substantial delays in opening remodeled or new convenience stores. In certain instances, these factors have led to delays and increased costs for our projects, and there can be no assurance that we will be able to achieve our growth targets by successfully implementing this strategy.
Significant changes in current consumption of cigarettes and other tobacco products and related regulations and litigation could materially adversely affect our business.
Cigarettes and other tobacco products accounted for approximately 39% of our total merchandise revenues for the year ended December 31, 2024. Significant increases in wholesale cigarette and other tobacco product prices, current and future tobacco legislation, including restrictions or bans on flavored and menthol tobacco products and related advertising, national, state and local campaigns to discourage smoking, a decrease in the consumption of cigarettes, increases in retail cigarette prices, lawsuits against manufacturers and retailers of cigarettes and other tobacco products, reductions in manufacturer rebates for the purchase of tobacco
9
products and increases in, and new, taxes on cigarettes and other tobacco products could have a material adverse effect on the demand for tobacco products, and on our customer transactions and, in turn, on our financial condition and results of operations.
Our financial condition and results of operations are influenced by changes in the wholesale prices of motor fuel, which may materially adversely impact our sales, operations, customers’ financial condition and the availability of trade credit.
During the year ended December 31, 2024, fuel sales were approximately 79% of our total revenues and approximately 46% of our combined fuel, merchandise and other income margin. Generally, our retail fuel inventory on hand turns quickly in the ordinary course of our business. Our operating results are influenced by prices for motor fuel, variable retail margins and the market for such products. Crude oil and domestic wholesale motor fuel markets are volatile. General political conditions, tariffs, trade wars, acts of war or terrorism and instability in oil producing regions, particularly in the Middle East, Russia, Africa and South America, could significantly affect crude oil supplies and wholesale fuel prices. Significant increases and volatility in wholesale fuel prices could result in substantial increases in the retail price of motor fuel products, lower fuel gross margin per gallon, lower demand for such products and lower sales to customers and dealers. This volatility makes it extremely difficult to predict the impact future wholesale cost fluctuations will have on our financial condition and results of operations. Increases in fuel prices generally compress retail fuel margin because fuel costs typically increase faster than retailers are able to pass them along to customers. In addition, when prices for motor fuel rise, some of our dealers may have insufficient credit to purchase motor fuel from us at their historical volumes. Furthermore, when motor fuel prices decrease, so do prompt payment incentives, which are generally calculated as a percentage of the total purchase price of the motor fuel distributed. Additionally, because the interchange fees we pay when credit cards are used to make purchases are based on transaction amounts, higher fuel prices at the pump result in higher credit card expenses. These additional fees increase operating expenses. Additionally, when diesel fuel prices rise, this results in higher truck shipping costs which causes shippers to consider alternative means for transporting freight, which may reduce trucking business and, in turn, may reduce our fuel sales volume. High diesel fuel prices may also cause our trucking customers to seek cost savings throughout their businesses, including measures which reduce total fuel consumption and may in turn reduce our fuel sales volume. Finally, higher prices for motor fuel may reduce our access to trade credit or worsen the terms under which such credit is available to us, which could have a material adverse effect on our financial condition and results of operations.
Significant changes in demand for fuel-based modes of transportation and for trucking services could materially adversely affect our business.
The road transportation fuel and convenience business is generally driven by consumer preferences, growth of road traffic, demand for trucking services, and trends in travel and tourism. Automotive, industrial and power generation manufacturers are developing more fuel-efficient engines, hybrid engines, electric vehicles and alternative clean power systems. In 2024, electric vehicles accounted for approximately 8.1% of all light vehicle sales in the United States. In addition, truck and other vehicle manufacturers and our customers continue to focus on ways to improve motor vehicle fuel efficiency and conserve fuel, including use of truck platooning, or the electronic linking of trucks with a lead vehicle, heat and kinetic energy recovery technologies, substantially lighter “super trucks” and higher efficiency motor fuels. In addition, there are government regulations aimed at reducing emissions and increasing fuel efficiency (e.g., ZEV mandates and low emission zones) and other factors to accelerate the transition to electric vehicles. Demand for trucking services in the U.S. generally reflects the amount of commercial activity in the U.S. economy. When the U.S. economy declines, demand for goods moved by trucks usually declines, and in turn demand for diesel fuel supplied by our fleet fueling segment typically declines, which could significantly harm our results of operations and financial condition.
A number of key factors could impact current customer behavior and trends with respect to road transportation and fuel consumption. These include new technologies providing increased access to non-fuel dependent means of transportation, legislation and regulations focused on fuel efficiency and lower fuel consumption, and the public’s general approach with regard to climate change and the effects of greenhouse gas emissions. Significant developments in any of the above-listed factors could lead to substantial changes in the demand for petroleum-based fuel and have a material adverse effect on our business, financial condition and results of operations.
We operate in a highly competitive, fragmented industry characterized by many similar competing products and services, and our inability to successfully compete could have a material adverse effect on our business.
We compete with other convenience stores, gas stations, large and small food retailers, quick service restaurants and dollar stores, as well as companies that provide delivered fuels. Because all such competitors offer products and services that are very similar to those offered by us, a number of key factors determine our ability to successfully compete in the marketplace. These include the location of stores and our competitors’ locations, competitive pricing, brand name recognition, convenient access routes, the quality, configuration and efficiency of stores and fueling facilities, and a high level of service. In particular, many large convenience store chains have expanded their number of locations and remodeled their existing locations in recent years, enhancing their competitive position. In addition, some of our competitors have greater financial resources and scale than us, which may provide them with competitive advantages in negotiating fuel and other supply arrangements.
Our inability to successfully compete in the marketplace by continuously meeting customer requirements concerning price, quality and service level could have a material adverse effect on our business, financial condition and results of operations.
10
Negative events or developments associated with branded motor fuel suppliers could have a material adverse impact on our revenues.
The success of our operations is dependent, in part, on the continuing favorable reputation, market value and name recognition associated with the motor fuel brands sold at our gas stations and to dealers. An event which adversely affects the value of those brands could have a negative impact on the volumes of motor fuel we distribute, which in turn could have a material adverse effect on our business, financial condition and results of operations.
We depend on several principal suppliers for our fuel purchases, third-party transportation providers for the transportation of most of our motor fuel and one principal supplier for merchandise. A failure by a principal supplier to renew its supply agreement, a disruption in supply, a significant change in supplier relationships or a significant incident related to a supplier could have a material adverse effect on our business and results of operations.
We depend on several principal suppliers for our fuel purchases, and we depend on one major vendor to supply a majority of our in-store merchandise. A significant disruption or operational failure affecting the operations of any of our suppliers, including its ability to provide timely deliveries, could materially impact the availability, quality and price of products and fuel sold at our sites, cause us to incur substantial unanticipated costs and expenses, and adversely affect our business, financial condition and results of operations.
Our fuel supply agreements expire on various dates through June 2032. If any of our principal suppliers elects not to renew its contracts with us, we may be unable to replace the volume of motor fuel we currently purchase from such supplier on similar terms or at all. We rely upon our suppliers to timely provide the volumes and types of motor fuels for which they contract. In times of extreme market demand, supply disruption or as a result of futures market and geopolitical conditions, we may be unable to acquire enough fuel, including diesel fuel in particular, to satisfy the demand of our customers. Most of the motor fuel we distribute is transported from terminals to gas stations and cardlock locations by third-party transportation providers. Such providers may suspend, reduce or terminate their obligations to us if certain events (such as force majeure) occur. A change of key transportation providers, a disruption or cessation in services or supply provided by our providers, a significant change in our relationship with our suppliers or a significant accident or other incident involving a transportation provider could have a material adverse effect on our business, financial condition and results of operations.
A significant portion of our revenue is generated under fuel supply agreements with dealers that must be renegotiated or replaced periodically. If we are unable to successfully renegotiate or replace these agreements, then our results of operations and financial condition could be adversely affected.
A significant portion of our revenue is generated under fuel supply agreements with dealers. As these supply agreements expire, they must be renegotiated or replaced. Our fuel supply agreements generally have an initial term of 10 years and, as of December 31, 2024, had a volume-weighted average remaining term of approximately 4.5 years. Our dealers have no obligation to renew their fuel supply agreements with us on similar terms or at all. We may be unable to renegotiate or replace our fuel supply agreements when they expire, and the terms of any renegotiated fuel supply agreements may not be as favorable as the terms of the agreements they replace. Whether these fuel supply agreements are successfully renegotiated or replaced is frequently subject to factors beyond our control. Such factors include fluctuations in motor fuel prices, a dealer’s ability to pay for or accept the contracted volumes and a competitive marketplace for the services offered by us. If we cannot successfully renegotiate or replace our fuel supply agreements, or must renegotiate or replace them on less favorable terms, revenues from these agreements could decline and our results of operations and financial condition could be adversely affected.
The retail sale, distribution, transportation and storage of motor fuels is subject to environmental protection and operational safety laws and regulations that may expose us or our customers to significant costs and liabilities, which could have a material adverse effect on our business.
We and our facilities, particularly the operation of gas stations, and the storage, transportation and sale of fuel products, are subject to various federal, state and local environmental, health and safety laws, and regulations, in particular, those related to the quality of fuel products, the handling and disposal of hazardous wastes and the prevention and remediation of environmental contaminations. These continue to evolve and have generally become more stringent over time. Most compliance costs are embedded in normal business operations. However, it is uncertain how much additional investment in technology, facilities, or increased operating costs will be necessary to address hazardous materials, environmental restoration, or new regulatory requirements.
Accidental leaks and spills requiring cleanup may occur during business operations, resulting in expenses for corrective actions or environmental investigations at our facilities, leased locations, or third-party sites we manage. Obligations may also arise at non-company locations where our products have been handled or disposed of, particularly if prior practices—acceptable at the time—require remediation to meet current standards.
Most of our fuel is transported by third-party carriers to our retail, dealer and fleet fueling sites. A portion of fuel is transported in our own trucks, therefore, our operations are also subject to hazards and risks inherent in transporting motor fuel. These hazards and risks include, but are not limited to, fires, explosions, traffic accidents, spills, discharges and other releases, and
11
cross-drops, any of which could result in distribution difficulties and disruptions, environmental pollution, governmentally-imposed fines or clean-up obligations, personal injury or wrongful death claims and other damage to our properties and the properties of others.
The transportation of motor fuels, as well as the associated storage of such fuels at locations including convenience stores, are subject to various federal, state and local environmental laws and regulations, covering storage tanks, material releases, hazardous waste management, and employee safety. These regulations require permits, compliance with pollution standards, and impose liability for pollution or non-compliance. Federal and state authorities, including the DOT and EPA, monitor compliance and may impose fines, penalties, or orders to halt operations.
Where releases of motor fuels or other substances or wastes have occurred, federal and state laws and regulations, and our lease agreements, require that contamination caused by such releases be assessed and remediated to meet applicable clean-up standards. Certain environmental laws impose strict, joint and several liability for costs required to clean-up and restore sites where motor fuels or other waste products have been disposed of or otherwise released. The costs associated with the investigation and remediation of contamination, as well as any associated third-party claims for damages or to impose corrective action obligations, could be substantial and could have a material adverse effect on us or our dealers.
Our business may also be affected by the adoption of environmental laws and regulations intended to address global climate change by limiting carbon emissions and introducing more stringent requirements for the exploration, drilling and transportation of crude oil and petroleum products. Wide-spread implementation of such laws and regulations may lead to a significant increase in the cost of petroleum-based fuels and, in turn, lower demand for road transportation fuel.
For more information on potential risks arising from environmental and occupational safety and health laws and regulations, please see “Business—Environmental and Other Government Regulations.”
Failure to comply with applicable laws and regulations could result in liabilities, penalties, costs, or license suspension or revocation that could have a material adverse effect on our business.
Our operations are subject to numerous federal, state and local laws and regulations, including regulations related to the sale of alcohol, cigarettes and other tobacco products, lottery products, other age-restricted products, operation of gaming machines, various food safety and product quality requirements, environmental laws and regulations, and various employment laws, including requirements for various licenses and registrations. To the extent we are not able to provide information that is required under such regulations because owners of our stock do not provide the necessary documentation to comply or fail to comply with such regulations, we may have those licenses suspended or revoked, or new licenses may not be issued.
Our violation of, or inability to comply with, such regulations could expose us to regulatory sanctions ranging from monetary fines to the revocation or suspension of our permits and licenses for the sale of such products. We may also be subject to litigation including class action litigation which may result in substantial costs, expenses and damages related to legal proceedings. Such regulatory action or litigation could adversely affect our business, financial condition and results of operations.
Our failure to comply with applicable labor and employment laws pertaining to, among others, minimum wage, overtime, rest breaks, mandated healthcare benefits or paid time-off benefits could result in increased regulatory scrutiny, monetary fines and substantial costs and expenses related to legal proceedings.
We are subject to extensive tax liabilities imposed by multiple jurisdictions that potentially have a material adverse effect on our financial condition and results of operations.
We are subject to extensive tax liabilities imposed by multiple jurisdictions, including income taxes, fuel excise taxes, sales and use taxes, payroll taxes, franchise taxes, property taxes and tobacco taxes. Many of these tax liabilities are subject to periodic audits by the respective taxing authorities. Changes in the tax laws could arise as a result of the base erosion and profit shifting project undertaken by the Organization for Economic Co-operation and Development (“OECD”). In December 2022, the European Union (“EU”) member states reached an agreement to implement the minimum tax component (“Pillar Two”) of the OECD’s tax reform initiative. The directive was enacted into the national law of the EU member states in 2023. If similar directives under Pillar Two are adopted by other taxing authorities, such changes could increase the amount of taxes we pay and therefore decrease our results of operations and cash flow. Additionally, substantial changes or reforms in the current tax regime could result in increased tax expenses and potentially have a material adverse effect on our financial condition and results of operations.
We rely on a large number of store employees. If we do not effectively manage our workforce, our labor costs and results of operations could be adversely affected.
With approximately 10,300 store employees, our labor costs represent one of our largest site operating expenses and our business is dependent on our ability to attract, train, and retain the appropriate mix of qualified employees. Most of our store employees are in entry-level or part-time positions, which historically have high turnover rates. Current employment trends and the prevailing wage rates in the markets in which we operate, including voluntary increases in wages because of current labor market
12
conditions, have increased our costs associated with recruiting and retaining qualified personnel, and may continue to do so in the future. Our ability to meet our changing labor needs while controlling our costs is subject to external factors outside of our control such as labor laws and mandatory requirements at the local, state and federal levels (such as minimum wages, overtime, rest breaks, paid leave time, and other social benefits), unemployment levels, prevailing wage rates, benefit costs, changing demographics, and our reputation and relevance within the labor market. If we are unable to attract and retain qualified personnel to work in our stores, do not provide proper training, or provide clear succession planning, our operations, customer service levels, reputation, and competitiveness could suffer and our results of operations could be adversely affected.
The loss of key senior management personnel or the failure to recruit or retain qualified senior management personnel could materially adversely affect our business.
We are dependent on our ability to recruit, train and retain qualified individuals to manage our business. Economic factors, the state of the current labor market and availability of other employment options for our management personnel could impact our ability to recruit and retain qualified personnel that could have a material impact on our results of operations and impact our ability to execute upon our strategic goals. If we do not provide proper training and clear succession planning or are unable to entice the necessary talent to join our company and retain our employees over time, we may not have appropriate staff to be promoted to management roles as they become available. Additionally, we are dependent on certain key employees to operate our business and the loss of any of our executive officers or other key employees could harm our business.
Unfavorable weather conditions could adversely affect our business.
Weather conditions have a significant effect on our sales, as retail customer transactions in higher profit margin products generally increase when weather conditions are favorable. Consequently, our results are seasonal, and we typically earn more during the warmer second and third quarters of the year. Severe weather phenomena, such as hurricanes, floods, and blizzards, may adversely affect our results of operations due to increased costs associated with such weather conditions, possible significant damage to our retail sites and infrastructure, and possible interruption of distributions to our dealer sites and fleet fueling sites. Temporary or long-term disruptions to our supply chain in connection with unfavorable weather conditions could impact our network of suppliers and distributors, significantly impacting the quality, variety and pricing of merchandise and fuel sold at our sites.
We are subject to payment-related risks that may result in higher operating costs or the inability to process payments, either of which could harm our brand, reputation, business, financial condition and results of operations.
We accept a variety of credit cards and debit cards in our convenience stores and at our fuel dispensers and, accordingly, we are, and will continue to be, subject to significant and evolving regulations and compliance requirements, including obligations to implement enhanced authentication processes that could result in increased costs and liability and reduce the ease of use of certain payment methods. Additionally, we pay interchange and other fees, which may increase over time.
Europay, MasterCard and Visa, or EMV, is a global standard for credit cards that uses computer chips to authenticate and secure chip-card transactions. We are liable for fraudulent credit card transactions at the fuel dispensers. As of December 31, 2024, due to the required time and cost necessary to upgrade each site, supply chain constraints related to necessary equipment, and contractor availability, we completed upgrading our fuel dispensers to be EMV-compliant at approximately 79% of our retail locations, and anticipate being substantially complete during 2025. Accordingly, we may be subject to liability for fraudulent credit card transactions processed at fuel dispensers that are not EMV-compliant.
We rely on fuel brands and independent service providers for payment processing, including credit and debit cards. If these fuel brands and independent service providers become unwilling or unable to provide these services to us, if the cost of using these providers increases, or if such providers have a data breach or mishandle our data, our business could be harmed. Additionally, there is a trend toward cardless payment methods, which may require additional investment to implement at our locations. As these trends develop, we will need to align our fleet card offering to the new technologies.
We are also subject to payment card association operating rules and agreements, including data security rules and agreements and certification requirements which could change or be reinterpreted to make it difficult or impossible for us to comply. In particular, we must comply with the Payment Card Industry Data Security Standard, or PCI DSS, a set of requirements designed to ensure that all companies that process, store or transmit payment card information maintain a secure environment to protect cardholder data. If we, or our third-party service providers, fail to comply with any of these rules or requirements, or if our, or our third-party service providers, data security systems are breached or compromised, we may be liable for losses incurred by card issuing banks or customers, subject to fines and higher transaction fees, lose our ability to accept credit or debit card payments from our customers, or process electronic fund transfers or facilitate other types of payments. Any failure to comply with such rules or requirements could significantly harm our brand, reputation, business, financial condition and results of operations.
13
Significant disruptions of information technology systems, breaches of data security or other cybersecurity incidents, or compromised data could materially adversely affect our business.
We rely on multiple information technology systems and a number of third-party vendor platforms (collectively, “IT Systems”) in order to run and manage our daily operations, including for fuel pricing, loyalty programs, payroll, accounting, budgeting, reporting, and store operations. Such IT Systems allow us to manage various aspects of our business, communicate with customers, and to provide reliable analytical information to our management. The future operation, success and growth of our business depends on streamlined processes made available through our uninhibited access to information systems, global communications, internet activity and other network processes. Like most other companies, despite our current cybersecurity risk management framework (see “Cybersecurity” for additional detail) and process controls, our IT Systems and those of our third-party service providers, may be vulnerable to information security breaches, ransomware or extortion, mishandled data, acts of vandalism, computer viruses and interruption or loss of valuable business data. Stored data might be improperly accessed due to a variety of events beyond our control, including, but not limited to, damage and interruption from power loss or natural disasters, computer system and network failures, loss of telecommunications services, physical and electronic loss of access to data and information, terrorist attacks, hackers, security breaches or other security incidents, and computer viruses or attacks. We rely on third-parties to provide maintenance and support of our IT Systems, and to store our data (including customer data) and a failure of any of these third-parties to provide adequate and timely support, or compromise of these third-parties’ systems, could adversely affect the operation of our IT Systems. We have technology security initiatives and disaster recovery plans in place to mitigate our risk to these vulnerabilities, but these measures may not be adequately designed or implemented to ensure that our operations are not disrupted or the data security breaches do not occur.
Hackers and data thieves are increasingly sophisticated and operate large-scale and complex attacks which may remain undetected until after they occur. Such attacks also may be further enhanced in frequency or effectiveness through threat actors’ use of artificial intelligence. Any breach of our network or those of our vendors may result in damage to our reputation, the loss of valuable business data, the misappropriation of our valuable intellectual property or trade secret information, misappropriation of our customers’ or employees’ personal information, key personnel being unable to perform duties or communicate throughout the organization, loss of retail sales, significant costs for data restoration and other adverse impacts on our business. Despite our existing security procedures and controls, if our network or the network of one of our service providers was compromised, it could give rise to unwanted media attention, materially damage our customer relationships, harm our business, reputation, results of operations, cash flows and financial condition, result in fines or litigation, and may increase the costs we incur to protect against such information security breaches, such as increased investment in technology, the costs of compliance with consumer protection laws and costs resulting from consumer fraud. In addition, successful cyberattacks, data breaches, or data security incidents, at one of our vendors, other convenience store operators, large retailers or other market participants, whether or not we are directly impacted, could lead to a general loss of customer confidence or affect our supply chain which could negatively affect us, including harming the market perception of the effectiveness of our security measures or harming the reputation of the industry in general, which could result in reduced use of our products and services.
The costs of mitigating cybersecurity risks are significant and are likely to increase in the future. These costs include, but are not limited to, retaining the services of cybersecurity providers; compliance costs arising out of existing and future cybersecurity, data protection and privacy laws and regulations; costs related to maintaining redundant networks, data backups and other damage-mitigation measures; and extra administrative costs to mitigate risk and deal with any system breaches. While we maintain cyber liability insurance, our insurance may not be sufficient to protect against all losses we may incur due to policy exclusions or if we suffer significant or multiple attacks.
We are subject to evolving laws, regulations, standards, and contractual obligations related to data privacy and security regulations, and our actual or perceived failure to comply with such obligations could harm our reputation, subject us to significant fines and liability, or otherwise adversely affect our business.
As a retailer of merchandise and retailer and wholesaler of fuel, we collect and store large amounts of data on our network, including personal data from customers and other sensitive information concerning our employees, customers and vendors. As such, we are subject to, or affected by, a number of federal, state, and local laws and regulations, as well as contractual obligations and industry standards, that impose certain obligations and restrictions with respect to data privacy and security, and govern our collection, storage, retention, protection, use, processing, transmission, sharing and disclosure of personal and other information including that of our employees, customers, and others. If we are found to have breached any such laws or regulations, we may be subject to enforcement actions that require us to change our business practices in a manner which may negatively impact our revenue, as well as expose us to litigation, fines, civil and/or criminal penalties and adverse publicity that could cause our customers to lose trust in us, negatively impacting our reputation and business in a manner that harms our financial position.
The U.S. Federal Trade Commission (the “FTC”) and state governments require companies to implement data security and privacy measures appropriate to the sensitivity of customer information, business size, and available tools. Failure to meet these expectations may result in claims of unfair or deceptive practices under the FTC Act or similar state laws, leading to potential legal actions for privacy and data security violations.
14
Further, we make public statements about our use and disclosure of personal information through our privacy policies that are posted on our websites and in our loyalty applications. The publication of our privacy policies and other statements that provide promises and assurances about data privacy and security can subject us to potential government or legal action if they are found to be deceptive, unfair or misrepresentative of our actual practices.
As described above, we are also subject to PCI DSS, which is a standard designed to protect credit card account data as mandated by payment card industry entities. We rely on vendors to handle PCI DSS matters and to ensure PCI DSS compliance. Despite our compliance efforts, we may become subject to claims that we have violated the PCI DSS based on past, present, and future business practices. Our actual or perceived failure to comply with the PCI DSS can subject us to fines, termination of banking relationships, and increased transaction fees.
In addition, numerous states already have, and are looking to expand, data protection and privacy legislation requiring companies like ours to consider solutions to meet differing needs and expectations of customers. Similar laws have been proposed at the federal level, reflecting a trend toward more stringent privacy legislation in the United States. The enactment of such laws could have potentially conflicting requirements that would make compliance challenging and we may not be able to monitor and react to all developments in a timely manner.
Our failure, and/or the failure by the various third-party service providers and partners with which we do business, to comply with applicable privacy policies or federal or state laws and regulations or any other obligations relating to privacy, data protection or information security, or any compromise of security that results in the unauthorized release of personal data or other user data, or the perception that any such failure or compromise has occurred, could negatively harm our brand and reputation, result in a loss sales and/or result in fines and/or proceedings by governmental agencies and/or customers, any of which could have a material adverse effect on our business, results of operations and financial condition.
Our business could suffer if we fail to adequately secure, maintain, and enforce our intellectual property rights.
We rely on our trademarks and trade names to distinguish some of our products and services from those of our competitors, and have registered or applied to register many of these trademarks. We cannot assure you that our trademark applications will be approved. Third-parties may also oppose our trademark applications, or otherwise challenge our use of the trademarks. In the event that our trademarks are successfully challenged, we could be forced to rebrand our products or services, which could result in loss of brand recognition, and could require us to devote resources advertising and marketing new brands. Further, we cannot assure you that competitors will not infringe our trademarks, or that we will have adequate resources to enforce our trademarks. Any claims of intellectual property infringement, even those without merit, could be expensive and time consuming to defend and divert management’s attention, cause us to cease making, licensing or using the products or services that incorporate the challenged intellectual property, require us to rebrand our products or services, if feasible, or require us to enter into royalty or licensing agreements in order to obtain the right to use a third-party’s intellectual property.
We also rely on trademarks that we license from third-parties to identify the branded fuels that we supply and trademarks in our quick service food offerings. If we violate the terms of these licenses, we could be liable for damages, and the licenses could be terminated. The termination or non-renewal of any of these licenses could require us to rebrand or to replace the licensed goods and services, and accordingly could have a material adverse effect on our business, reputation, financial condition and results of operations.
Our operations present risks which may not be fully covered by insurance.
We carry comprehensive insurance against the hazards and risks underlying our operations. We believe our insurance policies are customary in the industry; however, some losses and liabilities associated with our operations may not be covered by our insurance policies. In addition, there can be no assurance that we will be able to obtain similar insurance coverage on favorable terms (or at all) in the future. Significant uninsured losses and liabilities could have a material adverse effect on our financial condition and results of operations. Furthermore, our insurance is subject to high deductibles. As a result, certain large claims, even if covered by insurance, may require a substantial cash outlay by us, which could have a material adverse effect on our financial condition and results of operations.
Our variable rate debt could adversely affect our financial condition and results of operations.
Certain of our outstanding term loans and revolving credit facilities bear interest at variable rates, subjecting us to fluctuations in the short-term interest rate. Beginning in early 2022, in response to significant and prolonged increases in inflation, the U.S. Federal Reserve Board raised interest rates eleven times during 2022 and 2023, which increased the borrowing costs on our variable rate debt. The Federal Reserve Board then paused rate increases in the fourth quarter of 2023 following the deceleration of inflationary growth. The Federal Reserve Board cut interest rates in September 2024 and December 2024, and it may seek to further reduce interest rates, increase interest rates or maintain current interest rates. The timing, number and amount of any future interest rate changes are uncertain, and there can be no assurance that rates will continue to decrease at a rate currently predicted or at all, which would in turn negatively impact our borrowing costs. Any future federal fund rate increases could in turn make our financing activities, including those related to our acquisition activity, more costly and limit our ability to refinance existing debt when it
15
matures or pay higher interest rates upon refinancing and increase interest expense on refinanced indebtedness. As of December 31, 2024, approximately 49% of our debt bore interest at variable rates, which is based on CME Group’s forward-looking Secured Overnight Financing Rate (“SOFR”). Consequently, significant increases in market interest rates would create substantially higher debt service requirements, which could have a material adverse effect on our overall financial condition, including our ability to service our indebtedness.
The agreements governing our indebtedness contain various restrictions and financial covenants that may restrict our business and financing activities.
We depend on the earnings and cash flow generated by our operations in order to meet our debt service obligations. The operating and financial restrictions and covenants in our credit facilities and our 5.125% Senior Notes due 2029 (the “Senior Notes”), and any future financing agreements, may restrict our ability to finance future operations or expand our business activities. For example, certain of our credit facilities and our Senior Notes restrict our ability to, among other things: incur additional debt or issue guarantees; incur or permit liens to exist on certain property; pay dividends, redeem stock or make other distributions; make certain investments, acquisitions or other restricted payments; enter into certain types of transactions with affiliates; agree to certain restrictions on the ability of restricted subsidiaries to make payments to us; engage in certain asset sales; modify or terminate certain material contracts; and merge or dispose of all or substantially all of certain entities’ assets.
In addition, certain of the credit agreements governing our credit facilities contain covenants requiring us to maintain certain financial ratios. See “Management’s Discussion and Analysis of Financial Condition and Results of Operations—Contractual Obligations and Indebtedness” for additional information about our credit facilities and our Senior Notes.
Our ability to comply with these restrictions and covenants is uncertain and will be affected by the levels of cash flow from operations and other events or circumstances beyond our control. If market or other economic conditions deteriorate, our ability to comply with these covenants may be impaired. If we violate any provisions of our credit facilities or Senior Notes that are not cured or waived within the appropriate time periods provided in the agreements governing such indebtedness, a significant portion of our indebtedness may become immediately due and payable, and our lenders’ commitment to make further loans to us under certain of our credit facilities may terminate. We might not have, or be able to obtain, sufficient funds to make these accelerated payments.
If we were unable to repay the accelerated amounts, the lenders under our secured credit facilities could proceed against the collateral granted to them to secure such debt. If the payment of our debt is accelerated, our assets may be insufficient to repay such debt in full, which could result in our insolvency.
Risks Related to Our Organizational Structure and Securities
Our corporate structure includes Israeli entities that may expose us to additional tax liabilities.
Our corporate structure includes Israeli entities that file tax returns in Israel. Israeli tax authorities may challenge positions taken by such entities with respect to their tax returns. To the extent such a challenge is sustained, this could increase our worldwide effective tax rate and adversely impact our financial position and results of operations. In addition, tax law or regulations in Israel may be amended, and Israeli tax authorities may change their interpretations of existing tax law and regulations such that we may be subject to increased tax liabilities, including upon termination or liquidation of our Israeli entities. We may face additional tax liabilities in transferring cash through our Israeli entities by means of dividends or otherwise to support us, primarily due to withholding tax requirements imposed pursuant to the provisions of the Israeli tax law (which may be reduced under the provisions of the convention between the Government of the United States of America and the Government of Israel with respect to Taxes on Income), which could have a material adverse effect on our business, financial condition and results of operations.
Our amended and restated certificate of incorporation designates specific courts as the exclusive forum for certain litigation that may be initiated by our stockholders, which could limit our stockholders’ ability to obtain a favorable judicial forum for disputes with us.
Pursuant to our amended and restated certificate of incorporation, unless we consent in writing to the selection of an alternative forum, the Court of Chancery of the State of Delaware is the sole and exclusive forum for any state law claim for (1) any derivative action or proceeding brought on our behalf; (2) any action asserting a claim of or based on a breach of a fiduciary duty owed by any director, officer or other employee of ours to us or our stockholders; (3) any action asserting a claim pursuant to any provision of the Delaware General Corporation Law, our amended and restated certificate of incorporation or our bylaws; or (4) any action asserting a claim governed by the internal affairs doctrine (the “Delaware Forum Provision”). The Delaware Forum Provision will not apply to any causes of action arising under the Securities Act or the Exchange Act. Our amended and restated certificate of incorporation further provides that unless we consent in writing to the selection of an alternative forum, the United States District Court in Delaware shall be the sole and exclusive forum for resolving any complaint asserting a cause of action arising under the Securities Act (the “Federal Forum Provision”). In addition, our amended and restated certificate of incorporation provides that any
16
person or entity purchasing or otherwise acquiring any interest in shares of common stock is deemed to have notice of and consented to the Delaware Forum Provision and the Federal Forum Provision; provided, however, that stockholders cannot and will not be deemed to have waived our compliance with the federal securities laws and the rules and regulations thereunder.
We recognize that the Delaware Forum Provision and the Federal Forum Provision in our amended and restated certificate of incorporation may impose additional litigation costs on stockholders in pursuing any such claims, particularly if the stockholders do not reside in or near the State of Delaware. Additionally, the forum selection clauses in our amended and restated certificate of incorporation may limit our stockholders’ ability to bring a claim in a judicial forum that they find favorable for disputes with us or our directors, officers or employees, which may discourage the filing of lawsuits against us and our directors, officers and employees, even though an action, if successful, might benefit our stockholders. While the Delaware Supreme Court ruled in March 2020 that federal forum selection provisions purporting to require claims under the Securities Act be brought in federal court were “facially valid” under Delaware law, there is uncertainty as to whether courts in other jurisdictions will enforce the Federal Forum Provision. If the Federal Forum Provision is found to be unenforceable, we may incur additional costs associated with resolving such matters. The Federal Forum Provision may also impose additional litigation costs on stockholders who assert that the provision is not enforceable or invalid. The Court of Chancery of the State of Delaware may also issue different judgments than would other courts, including courts where a stockholder considering an action may be located or would otherwise choose to bring the action, and such judgments may be more or less favorable to us than our stockholders.
The majority of our common stock is held by a limited number of stockholders and their interests may conflict with yours in the future.
A limited number of stockholders beneficially owned approximately 67% of our outstanding voting stock as of December 31, 2024. Each share of common stock entitles its holders to one vote on all matters presented to stockholders. Accordingly, this limited number of stockholders can have a material impact in the election and removal of our directors and thereby determine corporate and management policies, including potential mergers or acquisitions, payment of dividends, asset sales, amendment of the certificate of incorporation and bylaws and other significant corporate transactions for so long as they retain significant ownership. This concentration of ownership may delay or deter possible changes in control, and reduces the liquidity of our shares, which may reduce the value of an investment in the common stock. So long as they continue to own a significant amount of the combined voting power, even if such amount is less than 50%, they will continue to be able to strongly influence or effectively control our decisions.
The market price and trading volume of our common stock has been and may be volatile and could decline significantly.
The market price of our common stock has been and may continue to be volatile and could decline significantly. Between January 1, 2024 and February 17, 2025, our common stock has ranged from a high of $8.42 per share to a low of $4.09 per share. In addition, the trading volume in our common stock may fluctuate and cause significant price variations to occur. If the market price of our common stock declines significantly, you may be unable to resell your shares at a price above your purchase price We cannot assure you that the market price of our common stock will not fluctuate widely or decline significantly in the future in response to a number of factors, including, among others: the realization of any of the risk factors presented in this Annual Report on Form 10-K; actual or anticipated differences in our estimates, or in the estimates of securities analysts, or the expectations of stockholders, or changes by securities analysts in their estimates of our future earnings; failure of our operating results to meet our published guidance; the performance and market valuations of other similar companies; and broad disruptions in the financial markets, including sudden disruptions in the credit markets.
In the past, securities class action litigation has often been instituted against companies following periods of volatility in the market price of their shares. This type of litigation could result in substantial costs and divert our management’s attention and resources, which could have a material adverse effect on us.
Sales of a substantial number of shares of our common stock in the public market could cause the price of our common stock to decline.
As of December 31, 2024, we had 115,771,318 shares of common stock outstanding and warrants to purchase approximately 18.4 million shares of common stock. We have registered shares of common stock that we may issue under our equity compensation plan. These shares may be sold freely in the public market upon issuance, subject to relevant vesting schedules, and applicable securities laws. Additionally, in the past we have issued, and may issue in the future, equity as part of the purchase price for an acquisition.
Sales of a substantial number of shares of our common stock in the public market or the perception that these sales might occur could depress the market price of our common stock and could impair our ability to raise capital through the sale of additional equity securities. We are unable to predict the effect that sales may have on the prevailing market price of our common stock.
We may not continue to declare cash dividends or may reduce the amount of cash dividends in the future.
17
In February 2022, we announced that our board of directors (the “Board”) authorized a regular dividend program under which we commenced payment of quarterly dividends on our common stock, subject to quarterly declarations in the sole discretion of our Board. Any future declarations of dividends, as well as the amount and timing of such dividends, are subject to capital availability and the discretion of our Board, which must evaluate, among other things, whether cash dividends are in the best interest of our stockholders and are in compliance with all applicable laws and any agreements containing provisions that limit our ability to declare and pay cash dividends.
Our ability to pay dividends in the future and their amount will depend upon, among other factors, our cash balances and potential future capital requirements, debt service requirements, earnings, financial condition, the general economic and regulatory climate, and other factors beyond our control that our Board may deem relevant. Our dividend payments may change from time to time, and we may not continue to declare dividends in the future. A reduction in or elimination of our dividend payments could have a negative effect on our stock price.
ITEM 1B. UNRESOLVED STAFF COMMENTS.
None.
ITEM 1C. CYBERSECURITY.
Cybersecurity risk management is a component of our overall risk management systems and processes and we recognize the importance of evaluating, detecting, and mitigating significant risks related to cybersecurity threats, including operational risks, theft of intellectual property, fraud, injury to employees or customers, and breach of applicable laws.
Our information security program aims to manage these cybersecurity risks and threats that we can reasonably anticipate using different methods, such as third-party assessments, internal IT audits, governance oversight, and risk and compliance reviews.
Our information security program also evaluates potential risks associated with certain third-parties with whom we do business, especially our service providers that deal with sensitive employee, business, or customer data. This includes risk evaluation before choosing such vendors, periodic assessment thereafter and if a third-party has a reported cybersecurity incident, we perform an assessment to find and reduce risks related to such third-party incident that may affect us.
Our systems regularly face attacks that aim to interrupt and delay our operations or obtain information from our systems. Any major disruption or nefarious access, to our systems or a third-party’s systems, could lead to disclosure or destruction of data, including employee, customer and corporate information, which may expose us to business, regulatory, litigation and reputation risk and could negatively affect our business and results of operations.
We perform various tasks designed to protect the Company from cybersecurity incidents, such as: conducting proactive cybersecurity reviews of systems and applications; performing penetration testing using external third-party tools and techniques; conducting employee training; and monitoring emerging laws and regulations related to data protection and information security. We evaluate risks from cyberattacks and technology threats and check our information systems for possible weaknesses. We use a risk quantification model created by the National Institute of Standards and Technology to find, assess and rank cybersecurity and technology risks and create related security controls and protections. Using third-party organizations and ongoing internal assessments, we regularly review and test our information security program to enhance our security measures and planning. We also
We follow incident response and breach management processes that principally consist of four interrelated steps to identify and assess material risks from cybersecurity threats: (1) preparing for a cybersecurity incident; (2) detecting and analyzing a cybersecurity incident; (3) containing, eliminating and recovering from the cybersecurity incident; and (4) analyzing the cybersecurity incident after it is resolved. We assess, rank and prioritize cybersecurity incidents based on their severity and impact on our operations and business. Our information security team, with assistance from our legal team, oversees cybersecurity incident response and breach management processes and commencing with the formation of the Board’s Cybersecurity Special Committee, reports to such committee.
18
Until November 2023, our Board had oversight responsibility for cybersecurity threats, and the SVP of IT provided cybersecurity-related information to the Board on a periodic basis.
In November 2023, the Board adopted cybersecurity processes, which strengthened and formalized company-wide procedures related to identifying, managing and assessing cybersecurity threats. In the event of a cybersecurity incident which is potentially material, the SVP of IT must report such incident to the Company’s CEO, CFO, General Counsel and the chair of the Cybersecurity Subcommittee, and these executives and board member determine whether, based on materiality or potential materiality,
ITEM 2. PROPERTIES.
As of December 31, 2024, we owned 390 properties, including 241 retail stores, 49 consignment agent locations, 69 lessee-dealer sites and 31 cardlock locations. Additionally, we have long-term control over a leased property portfolio composed of 1,630 locations as of December 31, 2024. Of the leased properties, 1,148 were retail stores, 116 were consignment agent locations, 212 were lessee-dealer sites and 154 were cardlock locations.
ITEM 3. LEGAL PROCEEDINGS.
Information with respect to this item may be found in Note 13 to the Consolidated Financial Statements, which information is incorporated herein by reference.
ITEM 4. MINE SAFETY DISCLOSURES.
Not applicable.
19
PART II
ITEM 5. MARKET FOR REGISTRANT’S COMMON EQUITY, RELATED STOCKHOLDER MATTERS AND ISSUER PURCHASES OF EQUITY SECURITIES.
Our common stock and publicly-traded warrants are listed on the Nasdaq Capital Market under the symbols “ARKO” and “ARKOW,” respectively.
As of February 24, 2025, there were 23 holders of record of our common stock and eight holders of record of our publicly-traded warrants to purchase one whole share of common stock at a price of $11.50 per share.
Information concerning the dividends called for by this item is incorporated herein by reference to Note 17, “Equity,” in the Consolidated Financial Statements.
Performance Graph
The following graph compares the performance of our common stock during the period beginning December 23, 2020 through December 31, 2024, assuming an investment of $100 on December 23, 2020, to that of the total return index for the S&P 500, the Russell 2000 and the S&P Retail Select Industry Index. In calculating total annual stockholder return, reinvestment of dividends, if any, is assumed. The indices are included for comparative purposes only. They do not necessarily reflect management’s opinion that such indices are an appropriate measure of the relative performance of our common stock.
The performance graph shall not be deemed incorporated by reference by any general statement incorporating by reference this Annual Report on Form 10-K into any filing under the Securities Act of 1933 or the Securities Exchange Act of 1934, except to the extent we specifically incorporate this information by reference, and shall not otherwise be deemed filed under such acts.
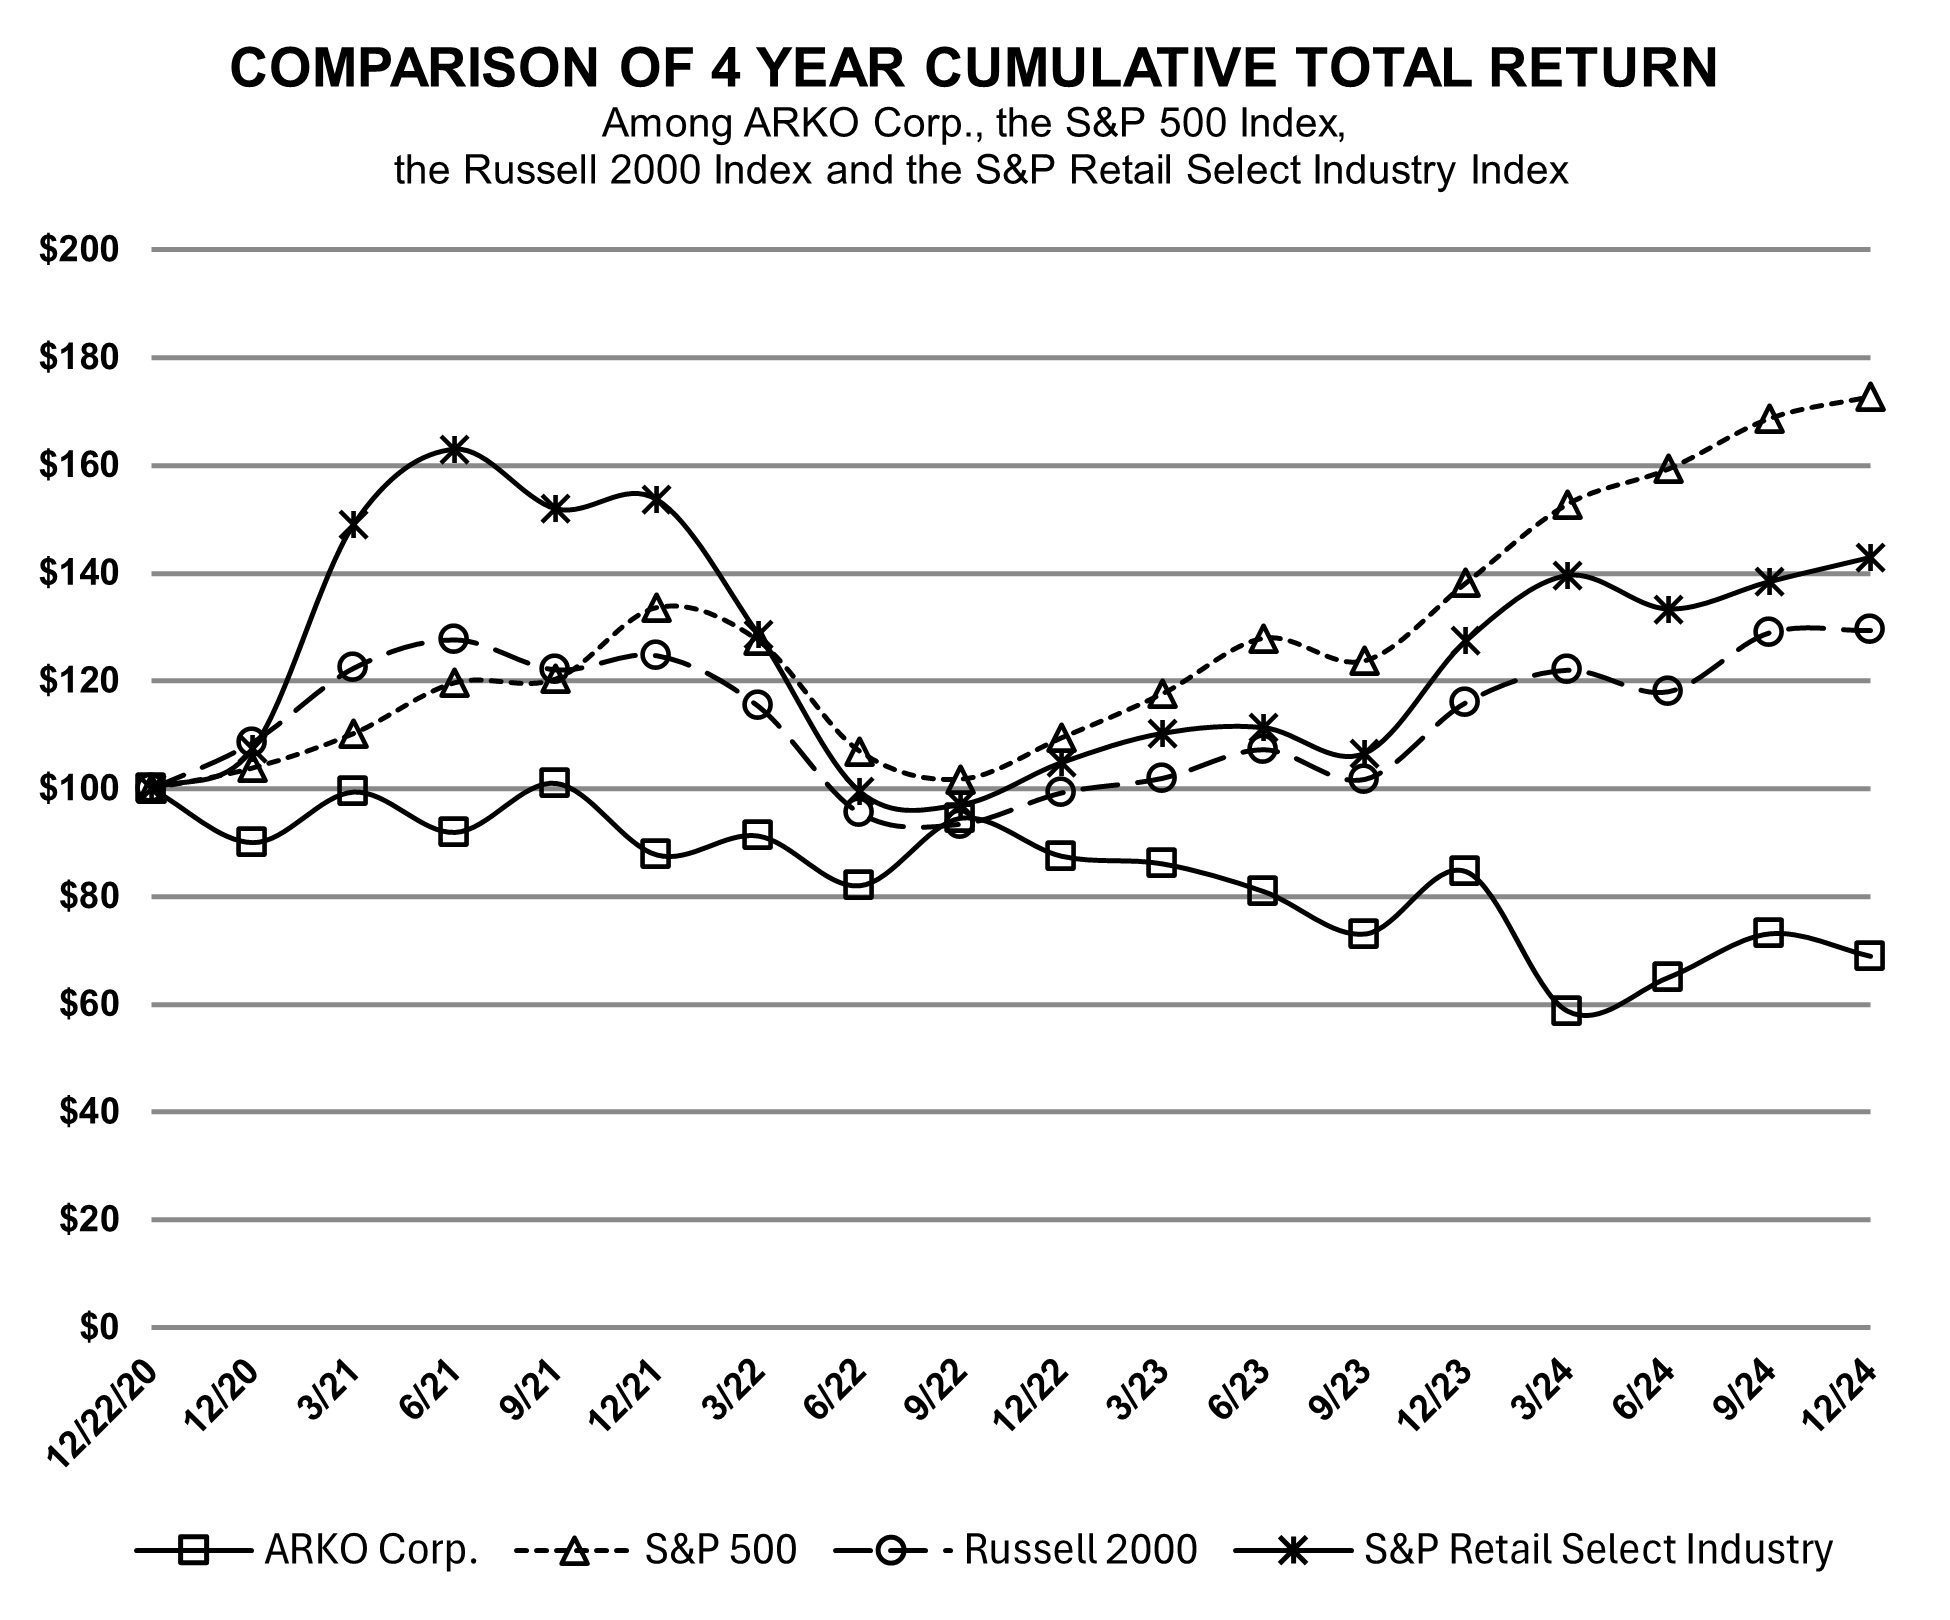
20
|
12/23/2020 |
|
12/31/2021 |
|
12/31/2022 |
|
12/31/2023 |
|
12/31/2024 |
|
|||||
|
|
|
|
|
|
|
|
|
|
|
|||||
ARKO Corp. |
$ |
100 |
|
$ |
87.70 |
|
$ |
87.47 |
|
$ |
84.61 |
|
$ |
68.89 |
|
S&P 500 |
|
100 |
|
|
133.65 |
|
|
109.45 |
|
|
138.22 |
|
|
172.80 |
|
Russell 2000 |
|
100 |
|
|
124.75 |
|
|
99.26 |
|
|
116.06 |
|
|
129.45 |
|
S&P Retail Select Industry Index |
|
100 |
|
|
153.59 |
|
|
104.87 |
|
|
127.46 |
|
|
142.91 |
|
21
ITEM 7. MANAGEMENT’S DISCUSSION AND ANALYSIS OF FINANCIAL CONDITION AND RESULTS OF OPERATIONS
This Annual Report on Form 10-K contains forward-looking statements within the meaning of the Private Securities Litigation Reform Act of 1995 (“PSLRA”), Section 27A of the Securities Act of 1933, as amended (the “Securities Act”), and Section 21E of the Securities Exchange Act of 1934, as amended, (the “Exchange Act”), about our expectations, beliefs, plans and intentions regarding our product development efforts, business, financial condition, results of operations, strategies and prospects. You can identify forward-looking statements by the fact that these statements do not relate to historical or current matters. Rather, forward-looking statements relate to anticipated or expected events, activities, trends or results. Because forward-looking statements relate to matters that have not yet occurred, these statements are inherently subject to risks and uncertainties that could cause our actual results to differ materially from any future results expressed or implied by the forward-looking statements. Many factors could cause our actual activities or results to differ materially from the activities and results anticipated in forward-looking statements. These factors include those contained in “Item 1A — Risk Factors” of this Annual Report on Form 10-K. Forward-looking statements reflect our views only as of the date they are made. We do not undertake any obligation to update forward-looking statements except as required by applicable law. We intend that all forward-looking statements be subject to the safe harbor provisions of PSLRA.
Overview
Based in Richmond, VA, we are a leading independent convenience store operator and, as of December 31, 2024, we were one of the largest convenience store chain in the United States (“U.S.”) ranked by store count, operating 1,389 retail convenience stores. As of December 31, 2024, we operated the stores under more than 25 regional store brands including 1-Stop, Admiral, Apple Market®, BreadBox, Corner Mart, Dixie Mart, ExpressStop, E-Z Mart®, fas mart®, fastmarket®, Flash Market, Handy Mart, Jetz, Jiffi Stop®, Jiffy Stop, Li’l Cricket, Market Express, Next Door Store®, Pride, Roadrunner Markets, Rose Mart, Rstore, Scotchman®, shore stop®, Speedy’s, SpeedyQ, Town Star, Uncle’s, Village Pantry® and Young’s. As of December 31, 2024, we also supplied fuel to 1,922 dealer locations and operated 280 cardlock locations (unstaffed fueling locations). We are well diversified geographically and as of December 31, 2024, operated in the District of Columbia and more than 30 states in the Mid-Atlantic, Midwestern, Northeastern, Southeastern and Southwestern U.S.
Our retail segment includes the operation of a chain of retail stores, which includes convenience stores selling fuel products and merchandise to retail customers, from which we generate a significant portion of our revenue and a large proportion of our profitability. We focus our marketing and merchandising initiatives at our retail stores on offering our customers an assortment of products with an attractive value proposition. Our retail offering includes a wide array of cold and hot foodservice, beverages, cigarettes and other tobacco products, candy, salty snacks, grocery, beer and general merchandise. We have foodservice offerings at approximately 1,185 stores, which include hot and fresh grab-n-go foods, deli, fried chicken, bakery, pizza, roller grill items and other prepared foods. In the first quarter of 2024, we launched an extensive new pizza program that offers private label pizza, at an attractive value of $4.99 for enrolled loyalty members. We currently offer our private label pizza at approximately 1,200 stores as take-and-bake from the freezer, and as fresh and hot pizza either whole or by the slice at approximately 220 stores. We supplement our foodservice offering with approximately 110 quick service major national brand restaurants. Relevant and delicious food offerings are a key strategic priority for us, and we expect to maintain a high degree of focus on frozen grab-n-go and enhanced hot food capabilities. Additionally, we provide a number of traditional convenience store services, including lottery, prepaid products, gift cards, money orders, ATMs, gaming, and other ancillary product and service offerings. We also generate revenues from car washes at approximately 75 of our locations.
We had approximately 2.3 million enrolled members in our fas REWARDS® loyalty program at the end of 2024, representing a year over year increase of approximately 13% from 2023. Our fas REWARDS® loyalty program is available in the majority of our stores and offers enrolled loyalty members in store exclusive promotional pricing, in-app member only deals not available without the app, as well as the ability to earn points that can be redeemed for either fuel or merchandise savings. Other in-app features include order and delivery, age verified offers on tobacco and alcohol, and a store locator with current gas prices at GPM stores nearby to members.
We also generate revenue from our wholesale distribution of fuel and the sale of fuel at cardlock locations, and we earn commissions from the sales of fuel using proprietary fuel cards that provide customers access to a nationwide network of fueling sites. We believe these revenues provide stable, ratable cash flows that, together with free cash flow from our retail segment, can be deployed to pursue accretive acquisitions and investments in our retail stores. The wholesale segment adds significant fuel volumes to our robust retail fuel sales, which we believe enhances our purchasing power for our entire platform, including our retail segment, and improves our competitiveness as an acquirer of choice.
22
Description of Segments
Our reportable segments are described below.
Retail Segment
Our retail segment includes the operation of a chain of retail stores, which includes convenience stores selling fuel products and merchandise to retail customers. At our convenience stores, we own the merchandise and fuel inventory and employ personnel to manage the store.
Wholesale Segment
Our wholesale segment supplies fuel to dealers, sub-wholesalers, and bulk and spot purchasers, on either a consignment or cost plus basis. For consignment arrangements, we retain ownership of the fuel inventory at the site, are responsible for the pricing of the fuel to the end consumer and share a portion of the gross profit earned from the sale of fuel with the consignment dealers. For cost plus arrangements, we sell fuel to dealers and bulk and spot purchasers on a fixed-fee basis. The sales price is determined according to the terms of the relevant agreement, which typically reflects our total fuel costs plus the cost of transportation and a margin, with us generally retaining the prompt pay discounts and rebates.
Fleet Fueling Segment
Our fleet fueling segment includes the operation of proprietary and third-party cardlock locations (unstaffed fueling locations), and commissions from the sales of fuel using proprietary fuel cards that provide customers access to a nationwide network of fueling sites.
GPMP Segment
Our GPMP segment engages in the wholesale distribution of fuel to substantially all of our sites that sell fuel in the retail and wholesale segments. GPM Petroleum LP (“GPMP”) sells fuel at GPMP’s cost of fuel (including taxes and transportation) plus a fixed margin and charges a fixed fee primarily to sites in the fleet fueling segment which are not supplied by GPMP.
Multi-Year Transformation Plan
We are currently continuing to develop and implement our Transformation Plan, which includes the following elements, among others:
23
As we proceed with this Transformation Plan, we may incur associated non-recurring expenses, including personnel costs, divestiture costs, professional services fees, and losses on disposal of assets and impairment charges.
Trends Impacting Our Business
We achieved strong store growth over the last decade, driven primarily by a highly successful acquisition strategy, inclusive of 26 completed acquisitions from 2013 through 2024. Most recently, on April 9, 2024, we completed our acquisition of 21 SpeedyQ Markets convenience stores located in Michigan (the “SpeedyQ Acquisition”). In March 2023, we acquired 135 convenience stores, 181 dealer locations, a commercial, government, and industrial business, and certain distribution and transportation assets from Transit Energy Group, LLC (the “TEG Acquisition”). In June 2023, we completed our acquisition of 24 Uncle’s convenience stores located across Western Texas, 68 proprietary GASCARD-branded cardlock sites and 43 private cardlock sites for fleet fueling operations located in Western Texas and Southeastern New Mexico from WTG Fuels Holdings, LLC (the “WTG Acquisition”). In August 2023, we acquired seven Speedy’s convenience stores located in Arkansas and Oklahoma, which were previously locations operated by a dealer to which we supplied fuel (the “Speedy’s Acquisition” and, together with the TEG Acquisition and the WTG Acquisition, the “2023 Acquisitions”). In July 2022, we completed our acquisition of certain assets from Quarles Petroleum, Incorporated (the “Quarles Acquisition”), which included on the acquisition date 121 proprietary Quarles-branded cardlock sites and 63 third-party cardlock sites for fleet fueling operations, and 46 dealer locations, and in December 2022, we completed our acquisition of Pride Convenience Holdings, LLC, which operated 31 Pride convenience stores on the acquisition date and had one store under construction that is now opened (the “Pride Acquisition” and together with the Quarles Acquisition, the “2022 Acquisitions”). Our strategic acquisitions have had, and may continue to have, a significant impact on our reported results and can make period to period comparisons of results difficult. We believe our significant size and scale aids our efforts to successfully deploy our organic growth strategies in our acquired assets, which we anticipate will result in value accretion. For additional information regarding our acquisitions, see Note 4 to the Consolidated Financial Statements.
In 2024, we expanded our pipeline to eight NTI (new to industry) stores, out of which we opened one NTI HandyMart location and a new Dunkin’ store in 2024, and in the first quarter of 2025, we opened a Dunkin’ store and a fastmarket® location, with the balance of the pipeline to be opened over the course of 2025.
Our store count has grown from 320 sites in 2011 to 3,591 sites as of December 31, 2024, of which 1,389 were operated as retail convenience stores, 1,922 were dealer locations to which we supplied fuel, and 280 were cardlock locations.
The following table provides a history of our acquisitions, site conversions and site closings for each of the last three years, for the retail, wholesale and fleet fueling segments:
|
|
For the Year Ended December 31, |
|
|||||||||
Retail Segment |
|
2024 |
|
|
2023 |
|
|
2022 |
|
|||
Number of sites at beginning of period |
|
|
1,543 |
|
|
|
1,404 |
|
|
|
1,406 |
|
Acquired sites |
|
|
21 |
|
|
|
166 |
|
|
|
32 |
|
Newly opened or reopened sites |
|
|
3 |
|
|
|
4 |
|
|
|
— |
|
Company-controlled sites converted to consignment or |
|
|
(153 |
) |
|
|
(16 |
) |
|
|
(17 |
) |
Sites closed, divested or converted to rentals |
|
|
(25 |
) |
|
|
(15 |
) |
|
|
(17 |
) |
Number of sites at end of period |
|
|
1,389 |
|
|
|
1,543 |
|
|
|
1,404 |
|
|
|
For the Year Ended December 31, |
|
|||||||||
Wholesale Segment 1 |
|
2024 |
|
|
2023 |
|
|
2022 |
|
|||
Number of sites at beginning of period |
|
|
1,825 |
|
|
|
1,674 |
|
|
|
1,628 |
|
Acquired sites |
|
|
— |
|
|
|
190 |
|
|
|
46 |
|
Newly opened or reopened sites 2 |
|
|
39 |
|
|
|
83 |
|
|
|
74 |
|
Consignment or fuel supply locations converted |
|
|
153 |
|
|
|
15 |
|
|
|
17 |
|
Closed or divested sites |
|
|
(95 |
) |
|
|
(137 |
) |
|
|
(91 |
) |
Number of sites at end of period |
|
|
1,922 |
|
|
|
1,825 |
|
|
|
1,674 |
|
1 Excludes bulk and spot purchasers.
2 Includes all signed fuel supply agreements irrespective of fuel distribution commencement date.
24
|
|
For the Year Ended December 31, |
|
|||||||||
Fleet Fueling Segment |
|
2024 |
|
|
2023 |
|
|
2022 |
|
|||
Number of sites at beginning of period |
|
|
298 |
|
|
|
183 |
|
|
|
— |
|
Acquired sites |
|
|
— |
|
|
|
111 |
|
|
|
184 |
|
Newly opened or reopened sites |
|
|
1 |
|
|
|
6 |
|
|
|
— |
|
Fleet fueling locations converted from fuel supply |
|
|
— |
|
|
|
1 |
|
|
|
— |
|
Closed or divested sites |
|
|
(19 |
) |
|
|
(3 |
) |
|
|
(1 |
) |
Number of sites at end of period |
|
|
280 |
|
|
|
298 |
|
|
|
183 |
|
In recent years, the convenience store industry has focused on increasing and improving in-store foodservice offerings, including fresh foods, quick service restaurants and proprietary food offerings. We believe consumers may be more likely to patronize convenience stores that include new and improved food offerings, which may also lead to increased inside merchandise sales or fuel sales. Our current foodservice offering, which varies by store, primarily consists of hot and fresh grab-n-go foods, deli, fried chicken, bakery, pizza, roller grill items and other prepared foods. We have historically relied upon a limited number of franchised quick service restaurants and in-store delis to drive customer traffic. As a result, we believe that our under-penetration of foodservice presents an opportunity to expand foodservice offerings and margin in response to changing consumer behavior. In the first quarter of 2024, we launched an extensive new pizza program as described above, and we are working on the expansion of our food offering as part of our Transformation Plan.
Our results of operation are significantly impacted by the retail fuel margins we earn on gallons sold. These fuel margins can change rapidly because they are influenced by many factors, including: the wholesale cost of fuel; interruptions in supply caused by severe weather; supply chain disruptions; refinery mechanical failures; and competition in the local markets in which we operate.
The cost of our main products, gasoline and diesel fuel, is greatly impacted by the wholesale cost of fuel in the United States. We attempt to pass wholesale fuel cost changes to our customers through retail price changes; however, we are not always able to do so. Competitive conditions primarily affect the timing of any related increase or decrease in retail prices. As a result, we tend to experience lower fuel margins when the cost of fuel is increasing gradually over a longer period and higher fuel margins when the cost of fuel is declining or more volatile over a shorter period of time. Depending on future market and geopolitical conditions, the supply of fuel, including diesel fuel in particular, may become constrained. Accordingly, we maintain terminal storage of diesel fuel for short-term supply needs for our fleet fueling sites.
Additionally, the significant increase in the rate of inflation in the U.S. in recent years and the effect of higher prevailing interest rates has increased merchandise cost and reduced consumer purchasing power. We have mitigated a portion of these higher costs with retail price increases. The persistence of, or increase in, inflation or high interest rates could negatively impact the demand for our products and services, including due to consumers reducing travel, which could reduce sales volumes. Because of recent and current labor market conditions and the prevailing wage rates in the markets in which we operate, we have increased wages, which has increased our costs associated with recruiting and retaining qualified personnel, and may continue to do so in the future. Additionally, any major changes in tax or trade policy between the U.S. and countries from which we or our suppliers source merchandise and other products for our sites, such as the imposition of additional tariffs or duties on imported products, could require us to take certain actions, including raising prices on products we sell and seeking alternative sources of supply.
We also operate in a highly competitive retail convenience market that includes businesses with operations and services that are similar to those that we provide. We believe that convenience stores managed by individual operators who offer branded or non-branded fuel are also significant competitors in the local markets in which we operate. Often, operators of both chains and individual stores compete by selling unbranded fuel at lower retail prices relative to the market. The convenience store industry is also experiencing competition from other retail sectors including grocery stores, large warehouse retail stores, dollar stores and pharmacies.
Seasonality
Our business is seasonal, and our operating income in the second and third quarters has historically been significantly greater than in the first and fourth quarters as a result of the generally favorable climate and seasonal buying patterns of our customers.
Results of Operations for the years ended December 31, 2024, 2023 and 2022
The period-to-period comparisons of our results of operations contained in this Management’s Discussion and Analysis of Financial Condition and Results of Operation have been prepared using the Consolidated Financial Statements and the notes thereto, and the following discussion should be read in conjunction with such Consolidated Financial Statements and related notes contained
25
elsewhere in this Annual Report on Form 10-K. All figures for fuel costs, fuel contribution and fuel margin per gallon exclude the estimated fixed margin or fixed fee paid to GPMP for the cost of fuel (intercompany charges by GPMP).
Consolidated Results
The table below shows our consolidated results for the years ended December 31, 2024, 2023 and 2022, together with certain key metrics.
|
|
For the Year Ended December 31, |
|
|||||||||
|
|
2024 |
|
|
2023 |
|
|
2022 |
|
|||
Revenues: |
|
(in thousands) |
|
|||||||||
Fuel revenue |
|
$ |
6,858,919 |
|
|
$ |
7,464,372 |
|
|
$ |
7,401,090 |
|
Merchandise revenue |
|
|
1,767,345 |
|
|
|
1,838,001 |
|
|
|
1,647,642 |
|
Other revenues, net |
|
|
105,698 |
|
|
|
110,358 |
|
|
|
94,067 |
|
Total revenues |
|
|
8,731,962 |
|
|
|
9,412,731 |
|
|
|
9,142,799 |
|
Operating expenses: |
|
|
|
|
|
|
|
|
|
|||
Fuel costs |
|
|
6,271,696 |
|
|
|
6,876,084 |
|
|
|
6,856,651 |
|
Merchandise costs |
|
|
1,187,776 |
|
|
|
1,252,879 |
|
|
|
1,146,423 |
|
Site operating expenses |
|
|
875,272 |
|
|
|
860,134 |
|
|
|
721,174 |
|
General and administrative expenses |
|
|
162,920 |
|
|
|
165,294 |
|
|
|
139,969 |
|
Depreciation and amortization |
|
|
132,414 |
|
|
|
127,597 |
|
|
|
101,752 |
|
Total operating expenses |
|
|
8,630,078 |
|
|
|
9,281,988 |
|
|
|
8,965,969 |
|
Other expenses, net |
|
|
7,858 |
|
|
|
12,729 |
|
|
|
9,816 |
|
Operating income |
|
|
94,026 |
|
|
|
118,014 |
|
|
|
167,014 |
|
Interest and other financial expenses, net |
|
|
(67,161 |
) |
|
|
(71,243 |
) |
|
|
(59,405 |
) |
Income before income taxes |
|
|
26,865 |
|
|
|
46,771 |
|
|
|
107,609 |
|
Income tax expense |
|
|
(6,144 |
) |
|
|
(12,166 |
) |
|
|
(35,557 |
) |
Income (loss) from equity investment |
|
|
124 |
|
|
|
(39 |
) |
|
|
(74 |
) |
Net income |
|
$ |
20,845 |
|
|
$ |
34,566 |
|
|
$ |
71,978 |
|
Less: Net income attributable to non-controlling interests |
|
|
— |
|
|
|
197 |
|
|
|
231 |
|
Net income attributable to ARKO Corp. |
|
$ |
20,845 |
|
|
$ |
34,369 |
|
|
$ |
71,747 |
|
Series A redeemable preferred stock dividends |
|
|
(5,750 |
) |
|
|
(5,750 |
) |
|
|
(5,750 |
) |
Net income attributable to common shareholders |
|
$ |
15,095 |
|
|
$ |
28,619 |
|
|
$ |
65,997 |
|
Fuel gallons sold |
|
|
2,189,245 |
|
|
|
2,241,805 |
|
|
|
1,971,011 |
|
Fuel margin, cents per gallon 1 |
|
|
26.8 |
|
|
|
26.2 |
|
|
|
27.6 |
|
Merchandise contribution 2 |
|
$ |
579,569 |
|
|
$ |
585,122 |
|
|
$ |
501,219 |
|
Merchandise margin 3 |
|
|
32.8 |
% |
|
|
31.8 |
% |
|
|
30.4 |
% |
Adjusted EBITDA 4 |
|
$ |
248,860 |
|
|
$ |
276,260 |
|
|
$ |
293,151 |
|
Non-cash rent expense 5 |
|
$ |
14,335 |
|
|
$ |
14,168 |
|
|
$ |
7,903 |
|
1 Calculated as fuel revenue less fuel costs divided by fuel gallons sold.
2 Calculated as merchandise revenue less merchandise costs.
3 Calculated as merchandise contribution divided by merchandise revenue.
4 Refer to “Use of Non-GAAP Measures” below for discussion of this non-GAAP performance measure and related reconciliation to net income.
5 Non-cash rent expense reflects the extent to which our GAAP rent expense recognized exceeded (or was less than) our cash rent payments. GAAP rent expense varies depending on the terms of our lease portfolio. For newer leases, our rent expense recognized typically exceeds our cash rent payments, whereas, for more mature leases, rent expense recognized is typically less than our cash rent payments.
For the year ended December 31, 2024 compared to the year ended December 31, 2023
For the year ended December 31, 2024, fuel revenue decreased by $605.5 million, or 8.1%, compared to the year ended December 31, 2023. The decrease in fuel revenue was attributable primarily to a decrease in the average price of fuel compared to 2023 and fewer gallons sold at same stores in 2024 compared to 2023, which was partially offset by incremental gallons sold related to the 2023 Acquisitions and the SpeedyQ Acquisition.
26
For the year ended December 31, 2024, merchandise revenue decreased by $70.7 million, or 3.8%, compared to the year ended December 31, 2023, primarily due to a decrease in same store merchandise revenues and a decrease in merchandise revenue from underperforming retail stores that we closed or converted to dealers. Offsetting this decrease was additional merchandise revenue from the 2023 Acquisitions and the SpeedyQ Acquisition.
For the year ended December 31, 2024, other revenues, net decreased by $4.7 million, or 4.2%, compared to the year ended December 31, 2023, primarily due to the regulatory state-wide elimination of Virginia skill gaming machine income, which was partially offset by additional revenue from the 2023 Acquisitions and the SpeedyQ Acquisition.
For the year ended December 31, 2024, total operating expenses decreased by $651.9 million, or 7.0%, compared to the year ended December 31, 2023. Fuel costs decreased $604.4 million, or 8.8% compared to 2023 due to both a lower average cost of fuel and fewer same store gallons sold, which were partially offset by incremental gallons related to the 2023 Acquisitions and the SpeedyQ Acquisition. Merchandise costs decreased $65.1 million, or 5.2%, compared to 2023, consistent with the reduction in merchandise revenue. For the year ended December 31, 2024, site operating expenses increased $15.1 million, or 1.8%, compared to 2023 primarily due to incremental expenses as a result of the 2023 Acquisitions and the SpeedyQ Acquisition, which were partially offset by a decrease in same store expenses and expenses from underperforming retail stores that we closed or converted to dealers.
For the year ended December 31, 2024, general and administrative expenses decreased $2.4 million, or 1.4%, compared to the year ended December 31, 2023, primarily due to a decrease of $2.7 million in share-based compensation expense and lower incentive accruals, partially offset by incremental expenses associated with the 2023 Acquisitions, annual wage increases and consulting support for the development of our Transformation Plan.
For the year ended December 31, 2024, depreciation and amortization expenses increased $4.8 million, or 3.8%, compared to the year ended December 31, 2023 primarily due to assets acquired in the past two years, largely in connection with the 2023 Acquisitions and the SpeedyQ Acquisition.
For the year ended December 31, 2024, other expenses, net decreased by $4.9 million, or 38.3%, compared to the year ended December 31, 2023 primarily due to lower acquisition and divestiture costs.
Operating income was $94.0 million for the year ended December 31, 2024, compared to $118.0 million for the year ended December 31, 2023. The decrease in operating income was primarily due to lower same store merchandise and fuel contribution and regulatory state-wide elimination of Virginia skill gaming machine income, partially offset by incremental income from the 2023 Acquisitions and the SpeedyQ Acquisition as well as the benefit from retail stores that were closed or converted to dealers in 2024. Reduced fuel contribution at comparable wholesale sites (as defined below) more than offset the increase in fleet fueling fuel contribution at comparable fleet fueling sites (as defined below).
For the year ended December 31, 2024, interest and other financial expenses, net decreased by $4.1 million compared to the year ended December 31, 2023 primarily as a result of $9.2 million recorded as financial income related to the issuance of the First Installment Shares (as defined in Note 4 to the Consolidated Financial Statements) as payment of deferred consideration and the settlement of deferred consideration related to the TEG Acquisition, an increase of $0.8 million in income recorded in 2024 compared to the prior year period for fair value adjustments related to the Ares Put Option, Public Warrants, Private Warrants and Additional Deferred Shares (each as defined in the notes to the Consolidated Financial Statements) and additional interest income generated in 2024, which was partially offset by higher average outstanding debt balances, a higher average interest rate for 2024 and higher interest expenses related to financial liabilities.
For the year ended December 31, 2024, income tax expense was $6.1 million compared to $12.2 million for the year ended December 31, 2023, and our effective tax rate for the years ended December 31, 2024 and 2023 was 22.8% and 26.0%, respectively.
For the year ended December 31, 2024, net income attributable to the Company was $20.8 million compared to $34.4 million for the year ended December 31, 2023.
For the year ended December 31, 2024, Adjusted EBITDA was $248.9 million, as compared to $276.3 million for the year ended December 31, 2023. Refer to “Use of Non-GAAP Measures” below for discussion of this non-GAAP performance measure and related reconciliation to net income.
27
For the year ended December 31, 2023 compared to the year ended December 31, 2022
For a discussion of the comparative results of operations for the years ended December 31, 2023 and 2022, refer to Part II, Item 7 “Management's Discussion and Analysis of Financial Condition and Results of Operations” in our Annual Report on Form 10-K for the year ended December 31, 2023, filed with the SEC on February 27, 2024.
Segment Results
Disclosure of Incremental Contributions From Acquisitions
In the discussion of our segment results, we disclose certain information with respect to our acquisitions on an “incremental” basis. For example, incremental fuel gallons sold with respect to recent acquisitions. Incremental amounts or gallons related to such acquisitions reflect only the change (i.e. increase) in the contribution of the acquisitions between the referenced periods. Therefore, when analyzing the incremental impact of the 2023 Acquisitions for the year ended December 31, 2024 compared to the year ended December 31, 2023, the TEG Acquisition’s results for the second, third and fourth quarters of 2024 and 2023, the WTG Acquisition’s results for the third and fourth quarters of 2024 and 2023, and the Speedy’s Acquisition’s results for the fourth quarters of 2024 and 2023 are excluded as they are already reflected in same store and comparable wholesale sites and comparable fleet fueling sites results, as defined below.
Retail Segment
The table below shows the results of the retail segment for the years ended December 31, 2024, 2023 and 2022, together with certain key metrics for the segment.
|
|
For the Year Ended December 31, |
|
|||||||||
|
|
2024 |
|
|
2023 |
|
|
2022 |
|
|||
Revenues: |
|
(in thousands) |
|
|||||||||
Fuel revenue |
|
$ |
3,509,935 |
|
|
$ |
3,858,777 |
|
|
$ |
3,887,549 |
|
Merchandise revenue |
|
|
1,767,345 |
|
|
|
1,838,001 |
|
|
|
1,647,642 |
|
Other revenues, net |
|
|
65,264 |
|
|
|
74,406 |
|
|
|
67,280 |
|
Total revenues |
|
|
5,342,544 |
|
|
|
5,771,184 |
|
|
|
5,602,471 |
|
Operating expenses: |
|
|
|
|
|
|
|
|
|
|||
Fuel costs 1 |
|
|
3,081,719 |
|
|
|
3,423,455 |
|
|
|
3,471,321 |
|
Merchandise costs |
|
|
1,187,776 |
|
|
|
1,252,879 |
|
|
|
1,146,423 |
|
Site operating expenses |
|
|
790,645 |
|
|
|
779,448 |
|
|
|
669,848 |
|
Total operating expenses |
|
|
5,060,140 |
|
|
|
5,455,782 |
|
|
|
5,287,592 |
|
Operating income |
|
$ |
282,404 |
|
|
$ |
315,402 |
|
|
$ |
314,879 |
|
Fuel gallons sold |
|
|
1,080,990 |
|
|
|
1,122,321 |
|
|
|
1,006,469 |
|
Same store fuel gallons sold decrease (%) 2 |
|
|
(6.1 |
%) |
|
|
(5.3 |
%) |
|
|
(8.1 |
%) |
Fuel contribution 3 |
|
$ |
428,216 |
|
|
$ |
435,322 |
|
|
$ |
416,228 |
|
Fuel margin, cents per gallon 4 |
|
|
39.6 |
|
|
|
38.8 |
|
|
|
41.4 |
|
Same store fuel contribution 2, 3 |
|
$ |
403,503 |
|
|
$ |
422,090 |
|
|
$ |
406,262 |
|
Same store merchandise sales (decrease) increase (%) 2 |
|
|
(5.4 |
%) |
|
|
0.4 |
% |
|
|
(1.0 |
%) |
Same store merchandise sales excluding cigarettes (decrease) increase (%) 2 |
|
|
(3.8 |
%) |
|
|
2.5 |
% |
|
|
2.6 |
% |
Merchandise contribution 5 |
|
$ |
579,569 |
|
|
$ |
585,122 |
|
|
$ |
501,219 |
|
Merchandise margin 6 |
|
|
32.8 |
% |
|
|
31.8 |
% |
|
|
30.4 |
% |
1 Excludes the estimated fixed margin or fixed fee paid to GPMP for the cost of fuel.
2 Same store is a common metric used in the convenience store industry. We consider a store a same store beginning in the first quarter in which the store had a full quarter of activity in the prior year. Refer to “Use of Non-GAAP Measures” below for discussion of this measure.
3 Calculated as fuel revenue less fuel costs. 2022 same store fuel contribution is presented compared to the 2023 store basis.
4 Calculated as fuel contribution divided by fuel gallons sold.
5 Calculated as merchandise revenue less merchandise costs.
6 Calculated as merchandise contribution divided by merchandise revenue.
The table below shows financial information and certain key metrics of the SpeedyQ Acquisition within the retail segment, for which there is no comparable information for the prior period.
28
|
|
For the Year Ended December 31, 2024 |
|
|
|
|
SpeedyQ 1 |
|
|
|
|
(in thousands) |
|
|
Date of Acquisition: |
|
Apr 9, 2024 |
|
|
Revenues: |
|
|
|
|
Fuel revenue |
|
$ |
38,937 |
|
Merchandise revenue |
|
|
20,719 |
|
Other revenues, net |
|
|
809 |
|
Total revenues |
|
|
60,465 |
|
Operating expenses: |
|
|
|
|
Fuel costs 2 |
|
|
33,455 |
|
Merchandise costs |
|
|
14,709 |
|
Site operating expenses |
|
|
9,760 |
|
Total operating expenses |
|
|
57,924 |
|
Operating income |
|
$ |
2,541 |
|
Fuel gallons sold |
|
|
11,865 |
|
Fuel contribution 3 |
|
|
5,482 |
|
Merchandise contribution 4 |
|
|
6,010 |
|
Merchandise margin 5 |
|
|
29.0 |
% |
1 Acquisition of 21 SpeedyQ retail stores.
2 Excludes the estimated fixed margin paid to GPMP for the cost of fuel.
3 Calculated as fuel revenue less fuel costs.
4 Calculated as merchandise revenue less merchandise costs.
5 Calculated as merchandise contribution divided by merchandise revenue.
For the year ended December 31, 2024 compared to the year ended December 31, 2023
Retail Revenues
For the year ended December 31, 2024, fuel revenue decreased by $348.8 million, or 9.0%, compared to the year ended December 31, 2023. The decrease in fuel revenue was attributable to a decrease in gallons sold at same stores of approximately 6.1%, or 65.5 million gallons, reflecting the challenging macro-economic environment, as well as a $0.19 per gallon decrease in the average retail price of fuel in 2024 as compared to 2023, primarily due to market factors. Partially offsetting these decreases was an incremental 41.3 million gallons sold, or $132.8 million in fuel revenue, contributed by the 2023 Acquisitions and the SpeedyQ Acquisition. Underperforming retail stores, which we closed or converted to dealers during 2024 to optimize profitability, also negatively impacted gallons sold by 19.3 million gallons.
For the year ended December 31, 2024, merchandise revenue decreased by $70.7 million, or 3.8%, compared to the year ended December 31, 2023, primarily caused by a decline in customer transactions reflecting the challenging macro-economic environment and a decrease in merchandise revenue of $43.6 million from underperforming retail stores that we closed or converted to dealers. The 2023 Acquisitions and the SpeedyQ Acquisition contributed approximately $64.6 million of incremental merchandise revenue. Same store merchandise sales decreased $94.6 million, or 5.4%, for 2024 compared to 2023. About half the decline in same store merchandise was caused by lower revenues from cigarettes.
For the year ended December 31, 2024, other revenues, net decreased by $9.1 million, or 12.3%, from the year ended December 31, 2023, primarily related to the regulatory state-wide elimination of Virginia skill gaming machine income, partially offset by additional income from the 2023 Acquisitions and the SpeedyQ Acquisition.
Retail Operating Income
For the year ended December 31, 2024, fuel contribution decreased $7.1 million, or 1.6%, compared to the year ended December 31, 2023, while fuel margin per gallon increased. Same store fuel margin per gallon for 2024 increased to 39.7 cents per gallon from 39.0 cents per gallon for 2023. Incremental fuel contribution from the 2023 Acquisitions and the SpeedyQ Acquisition of approximately $16.8 million was more than offset by a decrease in same store fuel contribution of $18.6 million. In addition, a decrease in fuel contribution of $6.1 million was related to underperforming retail stores that we closed or converted to dealers compared to 2023.
29
For the year ended December 31, 2024, merchandise contribution decreased $5.6 million, or 0.9%, compared to the year ended December 31, 2023, while merchandise margin increased to 32.8% in 2024 from 31.8% in 2023. The decrease in merchandise contribution was due to a decrease in same store merchandise contribution of $17.0 million and a decrease in merchandise contribution of $11.6 million related to underperforming retail stores that we closed or converted to dealers, partially offset by incremental merchandise contribution from the 2023 Acquisitions and the SpeedyQ Acquisition of $21.7 million. Merchandise contribution at same stores decreased in 2024 primarily due to lower contribution from several core destination categories, and cigarettes, partially offset by higher contribution from other tobacco products. Same store merchandise margin was 32.7% in 2024 compared to 31.9% in 2023.
For the year ended December 31, 2024, site operating expenses increased $11.2 million, or 1.4%, as compared to the year ended December 31, 2023, primarily due to $33.1 million of incremental expenses related to the 2023 Acquisitions and the SpeedyQ Acquisition. The increase in site operating expenses was partially offset by a decrease in same store operating expenses of $0.4 million as a result of lower credit card fees and personnel costs, and $22.1 million of reduced expenses related to underperforming retail stores that we closed or converted to dealers.
Wholesale Segment
The table below shows the results of the wholesale segment for the years ended December 31, 2024, 2023 and 2022, together with certain key metrics for the segment.
|
|
For the Year Ended December 31, |
|
|||||||||
|
|
2024 |
|
|
2023 |
|
|
2022 |
|
|||
Revenues: |
|
(in thousands) |
|
|||||||||
Fuel revenue |
|
$ |
2,799,869 |
|
|
$ |
3,039,904 |
|
|
$ |
3,234,145 |
|
Other revenues, net |
|
|
29,140 |
|
|
|
25,775 |
|
|
|
23,451 |
|
Total revenues |
|
|
2,829,009 |
|
|
|
3,065,679 |
|
|
|
3,257,596 |
|
Operating expenses: |
|
|
|
|
|
|
|
|
|
|||
Fuel costs 1 |
|
|
2,709,519 |
|
|
|
2,946,996 |
|
|
|
3,135,988 |
|
Site operating expenses |
|
|
39,679 |
|
|
|
39,703 |
|
|
|
42,543 |
|
Total operating expenses |
|
|
2,749,198 |
|
|
|
2,986,699 |
|
|
|
3,178,531 |
|
Operating income |
|
$ |
79,811 |
|
|
$ |
78,980 |
|
|
$ |
79,065 |
|
Fuel gallons sold – fuel supply locations |
|
|
794,796 |
|
|
|
801,260 |
|
|
|
746,513 |
|
Fuel gallons sold – consignment agent locations |
|
|
154,560 |
|
|
|
168,005 |
|
|
|
156,059 |
|
Fuel margin, cents per gallon 2 – fuel supply locations |
|
|
6.0 |
|
|
|
6.0 |
|
|
|
6.8 |
|
Fuel margin, cents per gallon 2 – consignment agent locations |
|
|
27.4 |
|
|
|
26.5 |
|
|
|
30.2 |
|
1 Excludes the estimated fixed margin or fixed fee paid to GPMP for the cost of fuel.
2 Calculated as fuel revenue less fuel costs divided by fuel gallons sold.
Note: Comparable wholesale sites exclude wholesale sites added through the 2023 Acquisitions and retail stores converted to dealers, until the first quarter in which these sites had a full quarter of wholesale activity in the prior year.
For the year ended December 31, 2024 compared to the year ended December 31, 2023
Wholesale Revenues
For the year ended December 31, 2024, fuel revenue decreased by $240.0 million, or 7.9%, compared to the year ended December 31, 2023, caused by a 19.9 million, or 2.1%, decrease in gallons sold and a decrease in the average price of fuel in 2024 as compared to 2023. Of total gallons sold, the 2023 Acquisitions contributed approximately 18.4 million incremental gallons, and the retail stores that were converted to dealers contributed 10.4 million gallons, which were more than offset by lower volumes at comparable wholesale sites.
Wholesale Operating Income
For the year ended December 31, 2024, wholesale operating income increased $0.8 million, compared to 2023. An increase of approximately $3.4 million in other revenues, net, was partially offset by a decrease in fuel contribution of approximately $2.6 million in 2024 compared to 2023. At fuel supply locations, fuel contribution decreased by $0.5 million, and fuel margin per gallon remained consistent with 2023, primarily due to decreased prompt pay discounts related to lower fuel costs and lower volumes at comparable wholesale sites, which was partially offset by incremental contribution from the retail stores converted to dealers of $0.7 million, and the 2023 Acquisitions. At consignment agent locations, fuel contribution decreased $2.1 million while fuel margin per
30
gallon increased for 2024 compared to 2023, primarily due to incremental contribution of $0.5 million from the retail stores converted to dealers, and the 2023 Acquisitions, which was offset by lower rack-to-retail margins and decreased prompt pay discounts related to lower fuel costs.
For the year ended December 31, 2024, site operating expenses remained consistent with those in the year ended December 31, 2023.
Fleet Fueling Segment
The table below shows the results of the fleet fueling segment for the years ended December 31, 2024, 2023 and 2022, together with certain key metrics for the segment. We added the fleet fueling segment only upon consummation of the Quarles Acquisition on July 22, 2022; therefore, the year ended December 31, 2022 does not reflect the operations of this segment for the entirety of 2022, which affects year-over-year comparability.
|
|
For the Year Ended December 31, |
|
|||||||||
|
|
2024 |
|
|
2023 |
|
|
2022 |
|
|||
Revenues: |
|
(in thousands) |
|
|||||||||
Fuel revenue |
|
$ |
515,462 |
|
|
$ |
530,937 |
|
|
$ |
270,670 |
|
Other revenues, net |
|
|
9,135 |
|
|
|
7,818 |
|
|
|
2,178 |
|
Total revenues |
|
|
524,597 |
|
|
|
538,755 |
|
|
|
272,848 |
|
Operating expenses: |
|
|
|
|
|
|
|
|
|
|||
Fuel costs 1 |
|
|
451,173 |
|
|
|
475,037 |
|
|
|
242,849 |
|
Site operating expenses |
|
|
24,917 |
|
|
|
22,298 |
|
|
|
8,733 |
|
Total operating expenses |
|
|
476,090 |
|
|
|
497,335 |
|
|
|
251,582 |
|
Operating income |
|
$ |
48,507 |
|
|
$ |
41,420 |
|
|
$ |
21,266 |
|
Fuel gallons sold – proprietary cardlock locations |
|
|
136,104 |
|
|
|
130,995 |
|
|
|
57,104 |
|
Fuel gallons sold – third-party cardlock locations |
|
|
12,814 |
|
|
|
9,832 |
|
|
|
2,882 |
|
Fuel margin, cents per gallon 2 – proprietary cardlock locations |
|
|
46.0 |
|
|
|
41.7 |
|
|
|
48.4 |
|
Fuel margin, cents per gallon 2 – third-party cardlock locations |
|
|
13.1 |
|
|
|
12.4 |
|
|
|
6.5 |
|
1 Excludes the estimated fixed fee paid to GPMP for the cost of fuel.
2 Calculated as fuel revenue less fuel costs divided by fuel gallons sold.
Note: Comparable fleet fueling sites exclude fleet fueling sites added through the 2023 Acquisitions, until the first quarter in which these sites had a full quarter of fleet fueling activity in the prior year.
For the year ended December 31, 2024 compared to the year ended December 31, 2023
Fleet Fueling Revenues
For the year ended December 31, 2024, fuel revenue decreased by $15.5 million, or 2.9%, and other revenues, net increased by $1.3 million, compared to the year ended December 31, 2023. Fleet fueling revenues were negatively impacted by a decrease in the average price of fuel in 2024 compared to 2023, which were partially offset by an 8.1 million increase in gallons sold, or 5.7%, primarily resulting from the WTG Acquisition.
Fleet Fueling Operating Income
For the year ended December 31, 2024, fuel contribution increased by $8.4 million compared to the year ended December 31, 2023. At proprietary cardlocks, fuel contribution increased by $7.9 million, and fuel margin per gallon also increased for the year ended December 31, 2024, compared to the year ended December 31, 2023. At third-party cardlock locations, fuel contribution increased $0.5 million, and fuel margin per gallon also increased for 2024 compared to 2023. These changes were primarily due to higher volumes and the cardlocks acquired in the WTG Acquisition.
For the year ended December 31, 2024, site operating expenses increased $2.6 million compared to the year ended December 31, 2023 primarily due to the WTG Acquisition.
GPMP Segment
The table below shows the results of the GPMP segment for the years ended December 31, 2024, 2023 and 2022, together with certain key metrics for the segment.
31
|
|
For the Year Ended December 31, |
|
|||||||||
|
|
2024 |
|
|
2023 |
|
|
2022 |
|
|||
Revenues: |
|
(in thousands) |
|
|||||||||
Fuel revenue – inter-segment 1 |
|
$ |
4,576,222 |
|
|
$ |
5,149,228 |
|
|
$ |
5,674,516 |
|
Fuel revenue – external customers |
|
|
3,624 |
|
|
|
3,681 |
|
|
|
5,160 |
|
Other revenues, net |
|
|
838 |
|
|
|
939 |
|
|
|
1,024 |
|
Other revenues, net – inter-segment 1 |
|
|
11,236 |
|
|
|
10,918 |
|
|
|
3,651 |
|
Total revenues |
|
|
4,591,920 |
|
|
|
5,164,766 |
|
|
|
5,684,351 |
|
Operating expenses: |
|
|
|
|
|
|
|
|
|
|||
Fuel costs |
|
|
4,481,926 |
|
|
|
5,052,391 |
|
|
|
5,585,050 |
|
General and administrative expenses |
|
|
3,585 |
|
|
|
3,162 |
|
|
|
2,897 |
|
Depreciation and amortization |
|
|
7,371 |
|
|
|
7,365 |
|
|
|
7,369 |
|
Total operating expenses |
|
|
4,492,882 |
|
|
|
5,062,918 |
|
|
|
5,595,316 |
|
Other (income), net |
|
|
— |
|
|
|
(598 |
) |
|
|
— |
|
Operating income |
|
$ |
99,038 |
|
|
$ |
102,446 |
|
|
$ |
89,035 |
|
Fuel gallons sold – inter-segment |
|
|
1,955,989 |
|
|
|
2,017,522 |
|
|
|
1,890,946 |
|
Fuel gallons sold – external customers |
|
|
1,044 |
|
|
|
1,364 |
|
|
|
1,592 |
|
Fuel margin, cents per gallon 2 |
|
|
5.0 |
|
|
|
5.0 |
|
|
|
5.0 |
|
1 Includes the estimated fixed margin or fixed fee paid to GPMP for the cost of fuel.
2 Calculated as fuel revenue less fuel costs divided by fuel gallons sold.
For the year ended December 31, 2024 compared to the year ended December 31, 2023
GPMP Revenues
For the year ended December 31, 2024, fuel revenue decreased by $573.1 million, or 11.1%, compared to the year ended December 31, 2023. The decrease in fuel revenue was attributable to a decrease in gallons sold and a decrease in the average price of fuel for 2024 compared to 2023.
For the years ended December 31, 2024 and 2023, other revenues, net were similar. Inter-segment other revenues, net primarily related to the fixed fee primarily charged to sites in the fleet fueling segment (currently 5.0 cents per gallon sold) and increased slightly for 2024 compared to 2023.
GPMP Operating Income
Fuel margin decreased by $2.6 million for the year ended December 31, 2024, compared to the year ended December 31, 2023, primarily due to fewer gallons sold to the retail and wholesale segments at a fixed margin.
For the year ended December 31, 2024, total general and administrative expenses increased slightly from those in the year ended December 31, 2023, and depreciation and amortization expenses for 2024 remained consistent with 2023.
Use of Non-GAAP Measures
We disclose certain measures on a “same store basis,” which is a non-GAAP measure. Information disclosed on a “same store basis” excludes the results of any store that is not a “same store” for the applicable period. A store is considered a same store beginning in the first quarter in which the store had a full quarter of activity in the prior year. We believe that this information provides greater comparability regarding our ongoing operating performance. Neither this measure nor those described below should be considered an alternative to measurements presented in accordance with generally accepted accounting principles in the United States (“GAAP”).
We define EBITDA as net income before net interest expense, income taxes, depreciation and amortization. Adjusted EBITDA further adjusts EBITDA by excluding the gain or loss on disposal of assets, impairment charges, acquisition and divestiture costs, share-based compensation expense, other non-cash items, and other unusual or non-recurring charges. Both EBITDA and Adjusted EBITDA are non-GAAP financial measures.
We use EBITDA and Adjusted EBITDA for operational and financial decision-making and believe these measures are useful in evaluating our performance because they eliminate certain items that we do not consider indicators of our operating performance. EBITDA and Adjusted EBITDA are also used by many of our investors, securities analysts, and other interested parties in evaluating
32
our operational and financial performance across reporting periods. We believe that the presentation of EBITDA and Adjusted EBITDA provides useful information to investors by allowing an understanding of key measures that we use internally for operational decision-making, budgeting, evaluating acquisition targets, and assessing our operating performance.
EBITDA and Adjusted EBITDA are not recognized terms under GAAP and should not be considered as a substitute for net income or any other financial measure presented in accordance with GAAP. These measures have limitations as analytical tools, and should not be considered in isolation or as substitutes for analysis of our results as reported under GAAP. We strongly encourage investors to review our financial statements and publicly filed reports in their entirety and not to rely on any single financial measure.
Because non-GAAP financial measures are not standardized, same store measures, EBITDA and Adjusted EBITDA, as defined by us, may not be comparable to similarly titled measures reported by other companies. It therefore may not be possible to compare our use of these non-GAAP financial measures with those used by other companies.
The following table contains a reconciliation of net income to EBITDA and Adjusted EBITDA for the years ended December 31, 2024, 2023 and 2022.
|
|
For the Year Ended December 31, |
|
|||||||||
|
|
2024 |
|
|
2023 |
|
|
2022 |
|
|||
|
|
(in thousands) |
|
|||||||||
Net income |
|
$ |
20,845 |
|
|
$ |
34,566 |
|
|
$ |
71,978 |
|
Interest and other financing expenses, net |
|
|
67,161 |
|
|
|
71,243 |
|
|
|
59,405 |
|
Income tax expense |
|
|
6,144 |
|
|
|
12,166 |
|
|
|
35,557 |
|
Depreciation and amortization |
|
|
132,414 |
|
|
|
127,597 |
|
|
|
101,752 |
|
EBITDA |
|
|
226,564 |
|
|
|
245,572 |
|
|
|
268,692 |
|
Acquisition and divestiture costs (a) |
|
|
5,168 |
|
|
|
9,079 |
|
|
|
8,162 |
|
Loss on disposal of assets and impairment charges (b) |
|
|
6,798 |
|
|
|
6,203 |
|
|
|
5,731 |
|
Share-based compensation expense (c) |
|
|
12,339 |
|
|
|
15,015 |
|
|
|
12,161 |
|
(Income) loss from equity investment (d) |
|
|
(124 |
) |
|
|
39 |
|
|
|
74 |
|
Fuel and franchise taxes received in arrears (e) |
|
|
(1,427 |
) |
|
|
— |
|
|
|
— |
|
Adjustment to contingent consideration (f) |
|
|
(20 |
) |
|
|
(604 |
) |
|
|
(2,204 |
) |
Internal entity realignment and streamlining (g) |
|
|
— |
|
|
|
— |
|
|
|
475 |
|
Other (h) |
|
|
(438 |
) |
|
|
956 |
|
|
|
60 |
|
Adjusted EBITDA |
|
$ |
248,860 |
|
|
$ |
276,260 |
|
|
$ |
293,151 |
|
|
|
|
|
|
|
|
|
|
|
|||
Additional information |
|
|
|
|
|
|
|
|
|
|||
Non-cash rent expense (i) |
|
|
14,335 |
|
|
|
14,168 |
|
|
|
7,903 |
|
33
Liquidity and Capital Resources
Our primary sources of liquidity are cash flows from operations, availability under our credit facilities and our cash balances. Our principal liquidity requirements are the financing of current operations, funding capital expenditures (including acquisitions), and servicing debt. We finance our inventory purchases primarily from customary trade credit aided by relatively rapid inventory turnover, as well as cash generated from operations. Rapid inventory turnover allows us to conduct operations without the need for large amounts of cash and working capital. We largely rely on internally generated cash flows and borrowings for operations, which we believe are sufficient to meet our liquidity needs for the foreseeable future.
Our ability to meet our debt service obligations and other capital requirements, including capital expenditures, as well as the cost of acquisitions, will depend on our future operating performance which, in turn, will be subject to general economic, financial, business, competitive, legislative, regulatory and other conditions, many of which are beyond our control. As a normal part of our business, we will from time to time consider opportunities to repay, redeem, repurchase or refinance our indebtedness, depending on market conditions. Changes in our operating plans, lower than anticipated sales, increased expenses, acquisitions, or other events may cause us to seek additional debt or equity financing in future periods. Additional debt financing could impose increased cash payment obligations, as well as covenants that may restrict our operations. There can be no guarantee that financing will be available on acceptable terms or at all. As of December 31, 2024, approximately 49% of our debt bore interest at variable rates, an increase from approximately 46% as of December 31, 2023, which has increased our interest rate risk and may require that we use more of our cash flow for the payment of interest if prevailing interest rates increase or we incur additional indebtedness under our variable rate facilities or otherwise. See also “Quantitative and Qualitative Disclosures about Market Risk—Interest Rate Risk.”
As of December 31, 2024, we were in a strong liquidity position of approximately $841 million, consisting of approximately $262 million of cash and cash equivalents and approximately $579 million of availability under our lines of credit available for certain purposes. This liquidity position currently provides us with adequate funding to satisfy our contractual and other obligations from our existing cash balances. As of December 31, 2024, we had no outstanding borrowings under our $140.0 million PNC Line of Credit (as defined below), $29.1 million of unused availability under the M&T equipment line of credit, described below, and $418.7 million of unused availability under our $800 million Capital One Line of Credit (as defined below), which we may elect to increase up to $1.0 billion, subject to obtaining additional financing commitments from current lenders or other banks, and subject to certain other terms.
The Board declared, and the Company paid, dividends of $0.03 per share of common stock on each of March 21, 2024, May 31, 2024, August 30, 2024, and December 3, 2024, totaling approximately $14.0 million. Additionally, the Board declared a quarterly dividend of $0.03 per share of common stock, to be paid on March 21, 2025 to stockholders of record as of March 10, 2025. The amount and timing of dividends payable on our common stock are within the sole discretion of our Board, which will evaluate dividend payments within the context of our overall capital allocation strategy on an ongoing basis, giving consideration to our current and forecast earnings, financial condition, cash requirements and other factors. There can be no assurance that we will continue to pay such dividends or the amounts of such dividends.
In May 2024, the Board increased the size of our share repurchase program for up to an aggregate of $125.0 million of our outstanding shares of common stock, from an aggregate of $100.0 million of our outstanding shares of common stock. During the year ended December 31, 2024, inclusive of the repurchase of the First Installment Shares from TEG, we repurchased approximately 4.8 million shares of common stock under the share repurchase program for approximately $28.3 million, or an average share price of $5.89. The share repurchase program does not have a stated expiration date. Whether and the extent to which we repurchase shares depends on a number of factors, including our financial condition, capital requirements, cash flows, results of operations, future business prospects and other factors management may deem relevant. The timing, volume, and nature of repurchases are subject to market conditions, applicable securities laws, and other factors, and the program may be amended, suspended or discontinued at any time. Repurchases may be effected from time to time through open market purchases, including pursuant to a pre-set trading plan meeting the requirements of Rule 10b5-1(c) of the Exchange Act, privately negotiated transactions, pursuant to accelerated share repurchase agreements entered into with one or more counterparties, or otherwise.
To date, we have funded capital expenditures primarily through funds generated from operations, funds received from vendors, sale-leaseback transactions, the issuance of debt and existing cash. Future capital required to finance operations, acquisitions, and raze-and-rebuild, functionally remodel and fully remodel and update stores is expected to come from cash on hand, cash generated by operations, availability under lines of credit, and additional long-term debt and equipment leases, as circumstances may dictate. In the short- to medium-term, we currently expect that our capital spending program will be primarily focused on remodeling and updating stores, including as part of our Transformation Plan, and maintaining our properties and equipment. In the medium- to
34
long-term, we currently expect that our capital spending program will align with our Transformation Plan. We do not expect such capital needs to adversely affect liquidity. We expect to remain opportunistic with respect to the expansion of our store base thorough acquisitions, and we will evaluate such opportunities in concert with our capital spending program.
Cash Flows for the Years Ended December 31, 2024, 2023 and 2022
Net cash provided by (used in) operating activities, investing activities and financing activities for the years ended December 31, 2024, 2023 and 2022 were as follows:
|
|
For the Year Ended December 31, |
|
|||||||||
|
|
2024 |
|
|
2023 |
|
|
2022 |
|
|||
Net cash provided by (used in): |
|
(in thousands) |
|
|||||||||
Operating activities |
|
$ |
221,858 |
|
|
$ |
136,094 |
|
|
$ |
209,256 |
|
Investing activities |
|
|
(114,858 |
) |
|
|
(296,822 |
) |
|
|
(175,488 |
) |
Financing activities |
|
|
(56,004 |
) |
|
|
85,357 |
|
|
|
10,555 |
|
Effect of exchange rates |
|
|
(9 |
) |
|
|
23 |
|
|
|
(97 |
) |
Total |
|
$ |
50,987 |
|
|
$ |
(75,348 |
) |
|
$ |
44,226 |
|
For a discussion of the comparison of our cash flows for the years ended December 31, 2023 and 2022, refer to Part II, Item 7“Management's Discussion and Analysis of Financial Condition and Results of Operations” in our Annual Report on Form 10-K for the year ended December 31, 2023, filed with the SEC on February 27, 2024, under the subheading “Cash Flows for the Years Ended December 31, 2023, 2022 and 2021.”
Operating Activities
Cash flows provided by operations are our main source of liquidity. We have historically relied primarily on cash provided by operating activities, supplemented as necessary from time to time by borrowings on our credit facilities and other debt or equity transactions to finance our operations and to fund our capital expenditures. Cash flow provided by operating activities is primarily impacted by our net income and changes in working capital.
For the year ended December 31, 2024, cash flows provided by operating activities were $221.9 million compared to $136.1 million for the year ended December 31, 2023. The increase was primarily the result of approximately $19.0 million of lower net tax payments, approximately $10.0 million of deposits received from dealers related to retail stores that will be converted to dealer locations, deferred income and dealer deposits received from dealers related to retail stores that were converted, incremental vendor incentives received and decreases in working capital as a result of the day of the week on which 2024 ended and the conversion of retail stores to dealers, which were partially offset by approximately $8.1 million of higher net interest payments and a decrease in Adjusted EBITDA of $27.4 million.
Investing Activities
Cash flows used in investing activities primarily reflect capital expenditures for acquisitions and replacing and maintaining existing facilities and equipment used in the business.
For the year ended December 31, 2024, cash used in investing activities decreased by $182.0 million to $114.9 million from $296.8 million for the year ended December 31, 2023. For the year ended December 31, 2024, we utilized $113.9 million for capital expenditures, including the purchase of certain fee properties, upgrades to fuel dispensers and other investments in our stores. We paid $9.5 million in net consideration for the SpeedyQ Acquisition, reflecting $54.5 million in aggregate purchase consideration, offset by $45.0 million paid by an affiliate of Blue Owl Real Estate Fund VI OP LP under the Company’s standby real estate purchase, designation and lease program agreement. Cash used in investing activities for the year ended December 31, 2023 was impacted by the purchase consideration paid for the 2023 Acquisitions.
Financing Activities
Cash flows from financing activities primarily consist of increases and decreases in the principal amount of our lines of credit and debt, and the issuance of common stock, net of dividends paid and common stock repurchases.
For the year ended December 31, 2024, financing activities consisted primarily of net receipts of $21.2 million from long-term debt, which was offset by repayments of $4.9 million for financing leases, $3.4 million for additional consideration payments related to the 2020 acquisition of the business of Empire Petroleum Partners, LLC, $14.0 million for dividend payments on common stock, $5.8 million for dividend payments on the Series A redeemable preferred stock and $32.0 million for common stock repurchases, including the repurchase of the First Installment Shares originally issued to pay deferred consideration in the TEG
35
Acquisition. We also made an early payment of $17.2 million, as payment in full and as a discount to the $25.0 million deferred consideration in the TEG Acquisition, which would have been due on March 1, 2025. See Note 4 to our Consolidated Financial Statements.
Contractual Obligations and Indebtedness
Contractual Obligations
The table below presents our significant contractual obligations as of December 31, 2024:
|
|
Obligations due by Period |
|
|||||||||||||||||
Contractual Obligations (1) |
|
Total |
|
|
Less than |
|
|
1-3 years |
|
|
3-5 years |
|
|
More than |
|
|||||
|
|
(in thousands) |
|
|||||||||||||||||
Debt obligations (2) |
|
$ |
1,109,528 |
|
|
$ |
68,557 |
|
|
$ |
141,296 |
|
|
$ |
899,449 |
|
|
$ |
226 |
|
Additional and contingent consideration related to |
|
|
5,951 |
|
|
|
5,951 |
|
|
|
— |
|
|
|
— |
|
|
|
— |
|
Deferred payments (non-discounted) (3) |
|
|
680 |
|
|
|
680 |
|
|
|
— |
|
|
|
— |
|
|
|
— |
|
Other financial obligations (4) |
|
|
307,050 |
|
|
|
16,899 |
|
|
|
34,159 |
|
|
|
34,232 |
|
|
|
221,760 |
|
Operating lease obligations |
|
|
2,478,858 |
|
|
|
181,136 |
|
|
|
360,991 |
|
|
|
351,506 |
|
|
|
1,585,225 |
|
Financing lease obligations |
|
|
499,948 |
|
|
|
28,096 |
|
|
|
43,546 |
|
|
|
50,591 |
|
|
|
377,715 |
|
|
|
$ |
4,402,015 |
|
|
$ |
301,319 |
|
|
$ |
579,992 |
|
|
$ |
1,335,778 |
|
|
$ |
2,184,926 |
|
Purchase commitments (in gallons) (5) |
|
|
3,600,549 |
|
|
|
1,346,467 |
|
|
|
1,559,158 |
|
|
|
368,904 |
|
|
|
326,020 |
|
Credit Facilities and Senior Notes
Senior Notes
As of December 31, 2024, the Company had outstanding $450 million aggregate principal amount of its 5.125% Senior Notes due 2029 (the “Senior Notes”). Issued in October 2021, the Senior Notes are guaranteed, on an unsecured senior basis, by certain of the Company’s wholly owned domestic subsidiaries (the “Guarantors”). The indenture governing the Senior Notes contains customary restrictive covenants that, among other things, generally limit the ability of the Company and substantially all of its subsidiaries to (i) create liens, (ii) pay dividends, acquire shares of capital stock and make payments on subordinated debt, (iii) place limitations on distributions from certain subsidiaries, (iv) issue or sell the capital stock of certain subsidiaries, (v) sell assets, (vi) enter into transactions with affiliates, (vii) effect mergers and (viii) incur indebtedness. The Senior Notes and the guarantees rank equally in right of payment with all of the Company’s and the Guarantors’ respective existing and future senior unsubordinated indebtedness and are effectively subordinated to all of the Company’s and the Guarantors’ existing and future secured indebtedness to the extent of the value of the collateral securing such indebtedness; and are structurally subordinated to any existing and future obligations of subsidiaries of the Company that are not Guarantors.
Financing Agreement with PNC
GPM and certain subsidiaries have a financing arrangement (as amended, the “PNC Credit Agreement”) with PNC Bank National Association (“PNC”) to provide a line of credit with an aggregate principal amount of up to $140 million for purposes of financing working capital (the “PNC Line of Credit”).
36
The PNC Line of Credit bears interest, as elected by GPM at: (a) SOFR Adjusted plus Term SOFR (as defined in the PNC Credit Agreement) plus a margin of 1.25% to 1.75% or (b) a rate per annum equal to the alternate base rate (as defined in the PNC Credit Agreement) plus a margin of 0% to 0.50%. Every quarter, the SOFR margin rate and the alternate base rate margin rate are updated based on the quarterly average undrawn availability of the line of credit. The calculation of the availability under the PNC Line of Credit is determined monthly subject to terms and limitations as set forth in the PNC Credit Agreement, taking into account the balances of receivables, inventory and letters of credit, among other things. As of December 31, 2024, $8.2 million of letters of credit were outstanding under the PNC Credit Agreement.
Financing Agreements with M&T Bank
GPM has a financing arrangement with M&T Bank that provides a line of credit for up to $45.0 million to purchase equipment on or before September 2026, which may be borrowed in tranches, as well as an aggregate original principal amount of $49.5 million of real estate loans (the “M&T Term Loans”). As of December 31, 2024, approximately $29.1 million remained available under the equipment line of credit.
Each additional equipment loan tranche under such financing agreement will have a term of up to five years from the date it is advanced, payable in equal monthly payments of principal plus interest of SOFR (as defined in the agreement) plus 2.75%. The M&T Term Loans bear interest at SOFR Adjusted (as defined in the agreement) plus 2.75% to 3.00% (depending on the loan), mature in June 2026 or November 2028 (depending on the loan) and are payable in monthly installments based on a fifteen-year amortization schedule, with the balance of each loan payable at maturity.
Financing Agreement with a Syndicate of Banks Led by Capital One, National Association (“Capital One”)
GPMP has a revolving credit facility with a syndicate of banks led by Capital One, National Association, in an aggregate principal amount of up to $800 million (the “Capital One Line of Credit”). At GPMP’s request, the Capital One Line of Credit can be increased up to $1.0 billion, subject to obtaining additional financing commitments from current lenders or from other banks, and subject to certain terms as detailed in the Capital One Line of Credit. The Capital One Line of Credit is available for general GPMP purposes, including working capital, capital expenditures and permitted acquisitions.
The Capital One Line of Credit matures on May 5, 2028. As of December 31, 2024, approximately $380.8 million was drawn on the Capital One Line of Credit, $0.5 million of letters of credit were outstanding under the Capital One Line of Credit and approximately $418.7 million was available thereunder.
The Capital One Line of Credit bears interest, as elected by GPMP at: (a) Adjusted Term SOFR (as defined in the agreement) plus a margin of 2.25% to 3.25% or (b) a rate per annum equal to the alternate base rate (as defined in the agreement) plus a margin of 1.25% to 2.25%. The margin is determined according to a formula in the Capital One Line of Credit that depends on GPMP’s leverage.
Critical Accounting Estimates
The preparation of financial statements and related disclosures in conformity with GAAP and the Company’s discussion and analysis of its financial condition and operating results require the Company’s management to make judgments, assumptions and estimates that affect the amounts reported. Note 2, “Summary of Significant Accounting Policies,” of the Consolidated Financial Statements describes the significant accounting policies and methods used in the preparation of the Company’s Consolidated Financial Statements. Management bases its estimates on historical experience and on various other assumptions it believes to be reasonable under the circumstances, the results of which form the basis for making judgments about the carrying values of assets and liabilities. We believe the following critical accounting estimates affect our more significant judgments and estimates used in the preparation of our Consolidated Financial Statements.
Application of ASC 842, Leases (“ASC 842”)
The lease liabilities and right-of-use assets are significantly impacted by the following:
37
Environmental provision and reimbursement assets
We estimate the anticipated environmental costs with respect to contamination arising from the operation of gasoline marketing operations and the use of aboveground and underground storage tanks as well as the costs of other exposures and recognize a liability when these losses are anticipated and can be reasonably estimated. Reimbursement for these expenses from various state underground storage tank trust funds or from insurance companies is recognized as an asset and included in other current assets or non-current assets, as appropriate. The scope of the reimbursement asset and liability is estimated by a third-party at least twice a year and adjustments are made according to past experience, changing conditions and changes in governmental policies.
Liability for dismantling and removing aboveground and underground storage tanks and restoring the site on which the storage tanks are located
The liability is based on our estimates with respect to the external costs which will be necessary to remove the aboveground and underground storage tanks in the future, regulatory requirements, discount rate and an estimate of the length of the useful life of the storage tanks.
Property and equipment and amortizable intangible assets
We evaluate property and equipment and amortizable intangible assets for impairment when facts and circumstances indicate that the carrying values of such assets may not be recoverable. When evaluating for impairment, we first compare the carrying value of the asset to the asset’s estimated future undiscounted cash flows. If the estimated undiscounted future cash flows are less than the carrying value of the asset, we determine if we have an impairment loss by comparing the carrying value of the asset to the asset's estimated fair value and recognize an impairment charge when the asset’s carrying value exceeds its estimated fair value. The adjusted carrying amount of the asset becomes its new cost basis and is depreciated over the asset’s remaining useful life.
Impairment of goodwill
We evaluate the need for impairment with regard to goodwill once a year or with greater frequency if there are indicators of impairment exist. Goodwill is tested for impairment by first comparing the fair value of a reporting unit with its carrying amount, including goodwill. The fair value of a reporting unit is determined according to assumptions and computations we set.
We perform an annual assessment to evaluate whether an impairment of goodwill exists. We performed the evaluation with the assistance of independent assessor which, for purposes of determining the fair value of the retail and GPMP reporting units to which the goodwill was attributed, utilized the income approach, namely, the present value of the future cash flows forecasted to be derived from the reporting units, as well as the market approach.
For the 2024 annual impairment test, the data used for the income approach was directly linked to our internal projections for 2025 through 2029. The long-term growth rate used in the terminal year was (0.6)% for the GPMP reporting unit, and was 3.0% for the retail reporting unit, in accordance with the relevant weighted average long-term nominal growth rate. The cash flows used assumed an unlevered, debt-free basis with no deduction for interest of debt principal to present the cash flows available for debt and equity holders. The discount rate for each reporting unit was determined based on the risk profile of each of the reporting units, and was derived from its weighted average cost of capital (“WACC”) as assessed by management with the assistance of an independent assessor. The WACC took into account both debt and equity. The discount rate applied to the cash flow projections for the GPMP and the retail reporting units was approximately 8.5% and 10.5%, respectively.
The impairment review was sensitive to changes in the key assumptions used. Our key assumptions included revenue and profit growth, capital expenditures, external industry data and past experiences. The major assumptions that could result in significant sensitivities were the discount rate, the long-term growth rate and capital expenditures. Sensitivity analyses were performed by applying various reasonable scenarios whereby the long-term growth rate and discount rate were adjusted within a reasonable range. None of the sensitivity scenarios indicated a potential impairment in any of the reporting units.
Deferred tax assets
We account for income taxes and the related accounts in accordance with FASB ASC Topic 740, Income Taxes (“ASC 740”). Deferred tax liabilities and assets are determined based on the difference between the financial statement and tax basis of assets and liabilities using enacted rates expected to be in effect during the year in which the differences reverse. Deferred tax assets are recognized for future tax benefits and credit carryforwards to the extent that it is probable that future taxable profit will be available against which the temporary differences can be utilized. We periodically assess the likelihood that we will be able to recover our deferred tax assets and reflect any changes in estimates in the valuation allowance. Deferred tax assets are reduced by a valuation
38
allowance when, in the opinion of management, it is more likely than not that some portion, or all, of the deferred tax assets will not be realized.
We are required to make judgments, estimates and assumptions to establish the amount of deferred tax assets to be recognized based on timing differences, the expected taxable income and its sources and the tax planning strategy.
ITEM 7A. Quantitative and Qualitative Disclosures about Market Risk
Commodity Price Risk
We have limited exposure to commodity price risk as a result of the payment and volume-related discounts in certain of our fuel supply contracts with our fuel suppliers, which are based on the market price of motor fuel. Significant increases in fuel prices could result in significant increases in the retail price of fuel and in lower sales to consumers and dealers. When fuel prices rise, some of our dealers may have insufficient credit to purchase fuel from us at their historical volumes. In addition, significant and persistent increases in the retail price of fuel could also diminish consumer demand, which could subsequently diminish the volume of fuel we distribute. A significant percentage of our sales are made with the use of credit cards. Because the interchange fees we pay when credit cards are used to make purchases are based on transaction amounts, higher fuel prices at the pump and higher gallon movements result in higher credit card expenses. These additional fees increase operating expenses. From time to time, we make use of derivative commodity instruments to manage risks associated with an immaterial number of gallons designed to offset changes in the price of fuel that are directly tied to firm commitments to purchase diesel fuel.
Interest Rate Risk
We may be subject to market risk from exposure to changes in interest rates based on our financing, investing, and cash management activities. The Senior Notes bear a fixed interest rate; therefore, an increase or decrease in prevailing interest rates has no impact on our debt service for the Senior Notes. As of December 31, 2024, the interest rate on our Capital One Line of Credit was 7.4%, the interest rate on our M&T Term Loans was 7.6% and the interest rate on the variable portion of our M&T equipment loan was 7.4% (approximately $15.9 million of the total loan). As of December 31, 2023, the interest rate on our Capital One Line of Credit was 8.2%, the interest rate on our M&T Term Loans was 8.4% and the interest rate on the variable portion of our M&T equipment loan was 8.1% (approximately $16.4 million of the total loan) As of December 31, 2024, approximately 49% of our debt bore interest at variable rates. Based on the outstanding balances at December 31, 2024, if our applicable interest rates each increase by 1%, then our debt service on an annual basis would increase by approximately $4.3 million. Interest rates on commercial bank borrowings and debt offerings could be higher than current levels, causing our financing costs to increase accordingly. Although this could limit our ability to raise funds in the debt capital markets, we expect to remain competitive with respect to acquisitions and capital projects, as our competitors would likely face similar circumstances. For additional information regarding our interest rate risk, see “Risk Factors—Risks Related to Our Business and Industry—Our variable rate debt could adversely affect our financial condition and results of operations.”
39
ITEM 8. FINANCIAL STATEMENTS AND SUPPLEMENTARY DATA
|
Page |
Report of Independent Registered Certified Public Accounting Firm (PCAOB ID Number |
F-1 |
F-3 |
|
F-4 |
|
F-5 |
|
F-6 |
|
F-9 |
40
ITEM 9. CHANGES IN AND DISAGREEMENTS WITH ACCOUNTANTS ON ACCOUNTING AND FINANCIAL DISCLOSURE
None.
ITEM 9A. CONTROLS AND PROCEDURES
Evaluation of Disclosure Controls and Procedures
We maintain disclosure controls and procedures (as defined in Rule 13a-15(e) under the Securities Exchange Act of 1934, as amended (the “Exchange Act”)), that are designed to ensure that information that is required to be disclosed in Exchange Act reports is recorded, processed, summarized and reported within the time periods specified in the SEC’s rules and forms, and that such information is accumulated and communicated to our management, including the Chief Executive Officer and Chief Financial Officer, as appropriate, to allow timely decisions regarding required disclosure.
Our disclosure controls and procedures are designed to provide reasonable assurance that information required to be disclosed by us in reports that we file or submit under the Exchange Act, is recorded, processed, summarized and reported within the time periods specified in the rules and forms of the SEC and that such information is accumulated and communicated to our management, including our Chief Executive Officer and Chief Financial Officer, as appropriate to allow timely decisions regarding required disclosure. We carried out an evaluation, under the supervision, and with the participation of our management, including our Chief Executive Officer and Chief Financial Officer, of the effectiveness of the design and operation of our disclosure controls and procedures as of December 31, 2024. Based on this evaluation, our Chief Executive Officer and Chief Financial Officer concluded that our disclosure controls and procedures were effective as of December 31, 2024.
Management’s Report on Internal Control over Financial Reporting
Our management is responsible for establishing and maintaining adequate internal control over financial reporting, as such term is defined in Rules 13a-15(f) and 15d-15(f) under the Exchange Act. Our internal control over financial reporting is a process designed to provide reasonable assurance regarding the reliability of financial reporting and the preparation of financial statements for external purposes in accordance with generally accepted accounting principles. All internal control systems, no matter how well designed, have inherent limitations. Therefore, even those systems determined effective could provide only reasonable assurance with respect to financial statement preparation and presentation.
Management under the supervision, and with the participation, of our Chief Executive Officer and Chief Financial Officer, conducted an evaluation of the effectiveness of our internal control over financial reporting as of December 31, 2024 based on the framework and criteria established in Internal Control — Integrated Framework (2013) issued by the Committee of Sponsoring Organizations of the Treadway Commission. This evaluation included review of the documentation of controls, evaluation of the design effectiveness of controls, testing of the operating effectiveness of controls and a conclusion on this evaluation.
Based on the foregoing evaluation, management concluded that the Company’s internal control over financial reporting was effective as of December 31, 2024 based on the specified criteria.
Our internal control over financial reporting as of December 31, 2024 has been audited by Grant Thornton LLP, an independent registered public accounting firm, as stated in their report, which appears in Item 8. “Financial Statements and Supplementary Data.”
Changes in Internal Control over Financial Reporting
There have been no changes in our internal control over financial reporting that occurred during the last fiscal quarter that have materially affected, or are reasonably likely to materially affect, our internal control over financial reporting.
ITEM 9B. OTHER INFORMATION
For the quarter ended December 31, 2024, none of our officers or directors
ITEM 9C. DISCLOSURE REGARDING FOREIGN JURISDICTIONS THAT PREVENT INSPECTIONS
Not applicable.
41
PART III
ITEM 10. Directors, Executive Officers and Corporate Governance
The information about directors required for this item is incorporated by reference from our Proxy Statement to be filed in connection with our 2025 Annual Meeting of Stockholders.
Code of Ethics
We have adopted a code of business conduct and ethics, called the Code of Business Conduct and Ethics, that applies to all of our directors, officers, including our principal executive, financial and accounting officers, and employees. The full text of the Code of Business Conduct and Ethics is available in the Governance section of our website at www.arkocorp.com under the tab “Governance” and is available in print to any stockholder who requests it. We intend to provide amendments or waivers to our Code of Business Conduct and Ethics for any of our directors and principal officers on our website within four business days after such amendment or waiver. The reference to our website address does not constitute incorporation by reference of any of the information contained on the website, and such information is not a part of this Annual Report on Form 10-K.
Insider Trading Policy
We have
ITEM 11. EXECUTIVE COMPENSATION
The information required for this item is incorporated by reference from our Proxy Statement to be filed in connection with our 2025 Annual Meeting of Stockholders.
ITEM 12. SECURITY OWNERSHIP OF CERTAIN BENEFICIAL OWNERS AND MANAGEMENT AND RELATED SHAREHOLDER MATTERS
The information required for this item is incorporated by reference from our Proxy Statement to be filed in connection with our 2025 Annual Meeting of Stockholders.
The information required for this item is incorporated by reference from our Proxy Statement to be filed in connection with our 2025 Annual Meeting of Stockholders.
ITEM 14. PRINCIPAL ACCOUNTING FEES AND SERVICES
The information required for this item is incorporated by reference from our Proxy Statement to be filed in connection with our 2025 Annual Meeting of Stockholders.
42
PART IV.
ITEM 15. EXHIBITS, FINANCIAL STATEMENT SCHEDULES.
(a) (1) Financial Statements: See Part II, Item 8 of this report.
(2) Schedule I - Condensed Financial Information of Registrant. Additionally, the financial statement schedule entitled “Schedule II – Valuation and Qualifying Accounts” has been omitted since the information required is included in the Consolidated Financial Statements and notes thereto. Other schedules are omitted because they are not required.
(3) Exhibits: See below.
Exhibit No. |
|
Description (1) |
2.1* |
|
|
3.1 |
|
|
3.2 |
|
|
4.1 |
|
|
4.2 |
|
|
4.3 |
|
|
4.4 |
|
|
4.5 |
|
|
4.6 |
|
|
4.7 |
|
|
4.8 |
|
|
4.9 |
|
|
10.1 |
|
|
10.2** |
|
|
10.3** |
|
Amendment to the ARKO Corp. 2020 Incentive Compensation Plan (incorporated by reference to Exhibit 10.1 to the Quarterly Report on Form 10-Q filed on August 6, 2024). |
10.4** |
|
|
10.5 |
|
43
10.6** |
|
|
10.7** |
|
|
10.8** |
|
|
10.9** |
|
|
10.10** |
|
|
10.11 |
|
|
10.12* |
|
|
10.13 |
|
|
10.14 |
|
|
10.15 |
|
|
10.16* |
|
|
10.17** |
|
|
10.18 |
|
|
10.19 |
|
|
10.20 |
|
|
10.21 |
|
|
10.22 |
|
|
10.23 |
|
|
10.24 |
|
44
10.25 |
|
|
10.26 |
|
|
10.27 |
|
|
10.28** |
|
|
10.29* |
|
|
10.30* |
|
|
10.31* |
|
|
10.32* |
|
|
10.33* |
|
|
10.34*+ |
|
|
10.35*+ |
|
|
10.36**+ |
|
|
19.1+ |
|
|
21.1+ |
|
|
23.1+ |
|
|
31.1+ |
|
|
31.2+ |
|
|
32.1++ |
|
|
32.2++ |
|
|
97.1 |
|
|
101.INS |
|
Inline XBRL Instance Document |
101.SCH |
|
Inline XBRL Taxonomy Extension Schema Document With Embedded Linkbase Documents |
104 |
|
Inline XBRL for the cover page of this Annual Report on Form 10-K, included in the Exhibit 101 Inline XBRL Document Set. |
(1) SEC file number for all Securities Exchange Act reports referenced in the exhibit list is 001-39828.
* Pursuant to Item 601(b)(10)(iv) of Regulation S-K, portions of this exhibit have been omitted because the Company customarily and actually treats the omitted portions as private or confidential, and such portions are not material and would likely cause competitive harm to the Company if publicly disclosed. The Company will supplementally provide a copy of an unredacted copy of this exhibit to the U.S. Securities and Exchange Commission or its staff upon request.
** Indicates management contract or compensatory plan arrangement.
+ Filed herewith.
++ Furnished herewith.
45
ITEM 16. FORM 10-K SUMMARY
None.
46
SIGNATURES
Pursuant to the requirements of Section 13 or 15(d) of the Securities Exchange Act of 1934, the registrant has duly caused this report to be signed on its behalf by the undersigned, thereunto duly authorized.
Date: February 26, 2025 |
ARKO CORP. |
|
|
|
|
|
By: |
/s/ Robert Giammatteo |
|
|
Robert Giammatteo |
|
|
Executive Vice President and Chief Financial Officer (on behalf of the Registrant and as Principal Financial and Accounting Officer) |
Pursuant to the requirements of the Securities Exchange Act of 1934, this report has been signed below by the following persons on behalf of the registrant and in the capacities and on the dates indicated.
|
|
|
|
|
Name |
|
Title |
|
Date |
/s/ Arie Kotler |
|
President, Chief Executive Officer and Chairman of the Board |
|
February 26, 2025 |
Arie Kotler |
|
(Principal Executive Officer) |
|
|
|
|
|
|
|
/s/ Robert Giammatteo |
|
Executive Vice President and Chief Financial Officer |
|
February 26, 2025 |
Robert Giammatteo |
|
(Principal Financial and Accounting Officer) |
|
|
|
|
|
|
|
/s/ Sherman K. Edmiston III |
|
Director |
|
February 26, 2025 |
Sherman K. Edmiston III |
|
|
|
|
|
|
|
|
|
/s/ Avram Friedman |
|
Director |
|
February 26, 2025 |
Avram Friedman |
|
|
|
|
|
|
|
|
|
/s/ Michael J. Gade |
|
Director |
|
February 26, 2025 |
Michael J. Gade |
|
|
|
|
|
|
|
|
|
/s/ Andrew R. Heyer |
|
Director |
|
February 26, 2025 |
Andrew R. Heyer |
|
|
|
|
|
|
|
|
|
/s/ Steven J. Heyer |
|
Director |
|
February 26, 2025 |
Steven J. Heyer |
|
|
|
|
|
|
|
|
|
/s/ Laura Karet |
|
Director |
|
February 26, 2025 |
Laura Karet |
|
|
|
|
47
Report of Independent registered public accounting firm
Board of Directors and Shareholders
ARKO Corp.
Opinion on the financial statements
We have audited the accompanying consolidated balance sheets of ARKO Corp. (a Delaware corporation) and subsidiaries (the “Company”) as of December 31, 2024 and 2023, the related consolidated statements of operations, changes in equity, and cash flows for each of the three years in the period ended December 31, 2024, and the related notes and financial statement schedule included under Item 15(a) (collectively referred to as the “consolidated financial statements”). In our opinion, the consolidated financial statements present fairly, in all material respects, the financial position of the Company as of December 31, 2024 and 2023, and the results of its operations and its cash flows for each of the three years in the period ended December 31, 2024, in conformity with accounting principles generally accepted in the United States of America.
We also have audited, in accordance with the standards of the Public Company Accounting Oversight Board (United States) (“PCAOB”), the Company’s internal control over financial reporting as of December 31, 2024, based on criteria established in the 2013 Internal Control—Integrated Framework issued by the Committee of Sponsoring Organizations of the Treadway Commission (“COSO”), and our report dated February 26, 2025 expressed an unqualified opinion.
Basis for opinion
These consolidated financial statements are the responsibility of the Company’s management. Our responsibility is to express an opinion on the Company’s consolidated financial statements based on our audits. We are a public accounting firm registered with the PCAOB and are required to be independent with respect to the Company in accordance with the U.S. federal securities laws and the applicable rules and regulations of the Securities and Exchange Commission and the PCAOB.
We conducted our audits in accordance with the standards of the PCAOB. Those standards require that we plan and perform the audit to obtain reasonable assurance about whether the financial statements are free of material misstatement, whether due to error or fraud. Our audits included performing procedures to assess the risks of material misstatement of the financial statements, whether due to error or fraud, and performing procedures that respond to those risks. Such procedures included examining, on a test basis, evidence regarding the amounts and disclosures in the financial statements. Our audits also included evaluating the accounting principles used and significant estimates made by management, as well as evaluating the overall presentation of the financial statements. We believe that our audits provide a reasonable basis for our opinion.
Critical audit matters
The critical audit matters are matters arising from the current period audit of the financial statements that were communicated or required to be communicated to the audit committee and that: (1) relate to accounts or disclosures that are material to the financial statements and (2) involved our especially challenging, subjective, or complex judgments. We determined that there are no critical audit matters.
/s/
We have served as the Company’s auditor since 2003.
February 26, 2025
F-1
Report of Independent registered public accounting firm
Board of Directors and Shareholders
ARKO Corp.
Opinion on internal control over financial reporting
We have audited the internal control over financial reporting of ARKO Corp. and subsidiaries (the “Company”) as of December 31, 2024, based on criteria established in the 2013 Internal Control—Integrated Framework issued by the Committee of Sponsoring Organizations of the Treadway Commission (“COSO”). In our opinion, the Company maintained, in all material respects, effective internal control over financial reporting as of December 31, 2024, based on criteria established in the 2013 Internal Control—Integrated Framework issued by COSO.
We also have audited, in accordance with the standards of the Public Company Accounting Oversight Board (United States) (“PCAOB”), the consolidated financial statements of the Company as of and for the year ended December 31, 2024, and our report dated February 26, 2025 expressed an unqualified opinion on those financial statements.
Basis for opinion
The Company’s management is responsible for maintaining effective internal control over financial reporting and for its assessment of the effectiveness of internal control over financial reporting, included in the accompanying Management’s Report on Internal Control over Financial Reporting. Our responsibility is to express an opinion on the Company’s internal control over financial reporting based on our audit. We are a public accounting firm registered with the PCAOB and are required to be independent with respect to the Company in accordance with the U.S. federal securities laws and the applicable rules and regulations of the Securities and Exchange Commission and the PCAOB.
We conducted our audit in accordance with the standards of the PCAOB. Those standards require that we plan and perform the audit to obtain reasonable assurance about whether effective internal control over financial reporting was maintained in all material respects. Our audit included obtaining an understanding of internal control over financial reporting, assessing the risk that a material weakness exists, testing and evaluating the design and operating effectiveness of internal control based on the assessed risk, and performing such other procedures as we considered necessary in the circumstances. We believe that our audit provides a reasonable basis for our opinion.
Definition and limitations of internal control over financial reporting
A company’s internal control over financial reporting is a process designed to provide reasonable assurance regarding the reliability of financial reporting and the preparation of financial statements for external purposes in accordance with generally accepted accounting principles. A company’s internal control over financial reporting includes those policies and procedures that (1) pertain to the maintenance of records that, in reasonable detail, accurately and fairly reflect the transactions and dispositions of the assets of the company; (2) provide reasonable assurance that transactions are recorded as necessary to permit preparation of financial statements in accordance with generally accepted accounting principles, and that receipts and expenditures of the company are being made only in accordance with authorizations of management and directors of the company; and (3) provide reasonable assurance regarding prevention or timely detection of unauthorized acquisition, use, or disposition of the company’s assets that could have a material effect on the financial statements.
Because of its inherent limitations, internal control over financial reporting may not prevent or detect misstatements. Also, projections of any evaluation of effectiveness to future periods are subject to the risk that controls may become inadequate because of changes in conditions, or that the degree of compliance with the policies or procedures may deteriorate.
/s/ GRANT THORNTON LLP
Charlotte, North Carolina
February 26, 2025
F-2
ARKO Corp.
Consolidated Balance Sheets
(in thousands, except share data)
|
|
As of December 31, |
|
|||||
|
|
2024 |
|
|
2023 |
|
||
Assets |
|
|
|
|
|
|
||
Current assets: |
|
|
|
|
|
|
||
Cash and cash equivalents |
|
$ |
|
|
$ |
|
||
Restricted cash |
|
|
|
|
|
|
||
Short-term investments |
|
|
|
|
|
|
||
Trade receivables, net |
|
|
|
|
|
|
||
Inventory |
|
|
|
|
|
|
||
Other current assets |
|
|
|
|
|
|
||
Total current assets |
|
|
|
|
|
|
||
Non-current assets: |
|
|
|
|
|
|
||
Property and equipment, net |
|
|
|
|
|
|
||
Right-of-use assets under operating leases |
|
|
|
|
|
|
||
Right-of-use assets under financing leases, net |
|
|
|
|
|
|
||
Goodwill |
|
|
|
|
|
|
||
Intangible assets, net |
|
|
|
|
|
|
||
Equity investment |
|
|
|
|
|
|
||
Deferred tax asset |
|
|
|
|
|
|
||
Other non-current assets |
|
|
|
|
|
|
||
Total assets |
|
$ |
|
|
$ |
|
||
Liabilities |
|
|
|
|
|
|
||
Current liabilities: |
|
|
|
|
|
|
||
Long-term debt, current portion |
|
$ |
|
|
$ |
|
||
Accounts payable |
|
|
|
|
|
|
||
Other current liabilities |
|
|
|
|
|
|
||
Operating leases, current portion |
|
|
|
|
|
|
||
Financing leases, current portion |
|
|
|
|
|
|
||
Total current liabilities |
|
|
|
|
|
|
||
Non-current liabilities: |
|
|
|
|
|
|
||
Long-term debt, net |
|
|
|
|
|
|
||
Asset retirement obligation |
|
|
|
|
|
|
||
Operating leases |
|
|
|
|
|
|
||
Financing leases |
|
|
|
|
|
|
||
Other non-current liabilities |
|
|
|
|
|
|
||
Total liabilities |
|
|
|
|
|
|
||
|
|
|
|
|
|
|
||
|
|
|
|
|
|
|||
Series A redeemable preferred stock ( |
|
|
|
|
|
|
||
|
|
|
|
|
|
|
||
Shareholders' equity: |
|
|
|
|
|
|
||
Common stock (par value $ |
|
|
|
|
|
|
||
Treasury stock, at cost - |
|
|
( |
) |
|
|
( |
) |
Additional paid-in capital |
|
|
|
|
|
|
||
Accumulated other comprehensive income |
|
|
|
|
|
|
||
Retained earnings |
|
|
|
|
|
|
||
Total shareholders' equity |
|
|
|
|
|
|
||
Non-controlling interest |
|
|
|
|
|
|
||
Total equity |
|
|
|
|
|
|
||
Total liabilities, redeemable preferred stock and equity |
|
$ |
|
|
$ |
|
||
The accompanying notes are an integral part of these consolidated financial statements.
F-3
ARKO Corp.
Consolidated Statements of Operations
(in thousands, except share data)
|
|
For the Year Ended December 31, |
|
|||||||||
|
|
2024 |
|
|
2023 |
|
|
2022 |
|
|||
Revenues: |
|
|
|
|
|
|
|
|
|
|||
Fuel revenue 1 |
|
$ |
|
|
$ |
|
|
$ |
|
|||
Merchandise revenue |
|
|
|
|
|
|
|
|
|
|||
Other revenues, net |
|
|
|
|
|
|
|
|
|
|||
Total revenues |
|
|
|
|
|
|
|
|
|
|||
Operating expenses: |
|
|
|
|
|
|
|
|
|
|||
Fuel costs 1 |
|
|
|
|
|
|
|
|
|
|||
Merchandise costs |
|
|
|
|
|
|
|
|
|
|||
Site operating expenses |
|
|
|
|
|
|
|
|
|
|||
General and administrative expenses |
|
|
|
|
|
|
|
|
|
|||
Depreciation and amortization |
|
|
|
|
|
|
|
|
|
|||
Total operating expenses |
|
|
|
|
|
|
|
|
|
|||
Other expenses, net |
|
|
|
|
|
|
|
|
|
|||
Operating income |
|
|
|
|
|
|
|
|
|
|||
Interest and other financial income |
|
|
|
|
|
|
|
|
|
|||
Interest and other financial expenses |
|
|
( |
) |
|
|
( |
) |
|
|
( |
) |
Income before income taxes |
|
|
|
|
|
|
|
|
|
|||
Income tax expense |
|
|
( |
) |
|
|
( |
) |
|
|
( |
) |
Income (loss) from equity investment |
|
|
|
|
|
( |
) |
|
|
( |
) |
|
Net income |
|
$ |
|
|
$ |
|
|
$ |
|
|||
Less: Net income attributable to non-controlling interests |
|
|
|
|
|
|
|
|
|
|||
Net income attributable to ARKO Corp. |
|
$ |
|
|
$ |
|
|
$ |
|
|||
Series A redeemable preferred stock dividends |
|
|
( |
) |
|
|
( |
) |
|
|
( |
) |
Net income attributable to common shareholders |
|
$ |
|
|
$ |
|
|
$ |
|
|||
Net income per share attributable to common shareholders — basic |
|
$ |
|
|
$ |
|
|
$ |
|
|||
Net income per share attributable to common shareholders — diluted |
|
$ |
|
|
$ |
|
|
$ |
|
|||
Weighted average shares outstanding: |
|
|
|
|
|
|
|
|
|
|||
Basic |
|
|
|
|
|
|
|
|
|
|||
Diluted |
|
|
|
|
|
|
|
|
|
|||
Supplemental information: |
|
|
|
|
|
|
|
|
|
|||
1 Includes excise tax of: |
|
$ |
|
|
$ |
|
|
$ |
|
|||
The accompanying notes are an integral part of these consolidated financial statements.
F-4
ARKO Corp.
Consolidated Statements of Changes in Equity
(in thousands, except share data)
|
|
Common Stock |
|
|
Treasury |
|
|
|
|
|
|
|
|
|
|
|
|
|
|
|
|
|
|
|
||||||||||||
|
|
Shares |
|
|
Par |
|
|
Stock, at Cost |
|
|
Additional |
|
|
Accumulated |
|
|
Retained Earnings |
|
|
Total |
|
|
Non- |
|
|
Total |
|
|||||||||
Balance at December 31, 2021 |
|
|
|
|
$ |
|
|
$ |
|
|
$ |
|
|
$ |
|
|
$ |
|
|
$ |
|
|
$ |
|
|
$ |
|
|||||||||
Share-based compensation |
|
|
— |
|
|
|
|
|
|
|
|
|
|
|
|
|
|
|
|
|
|
|
|
|
|
|
|
|
||||||||
Transactions with non-controlling |
|
|
— |
|
|
|
|
|
|
|
|
|
|
|
|
|
|
|
|
|
|
|
|
|
( |
) |
|
|
|
|||||||
Distributions to non-controlling interests |
|
|
— |
|
|
|
|
|
|
|
|
|
|
|
|
|
|
|
|
|
|
|
|
|
( |
) |
|
|
( |
) |
||||||
Dividends on redeemable preferred stock |
|
|
— |
|
|
|
|
|
|
|
|
|
|
|
|
|
|
|
( |
) |
|
|
( |
) |
|
|
|
|
|
( |
) |
|||||
Dividends declared (9 cents per share) |
|
|
— |
|
|
|
|
|
|
|
|
|
|
|
|
|
|
|
( |
) |
|
|
( |
) |
|
|
|
|
|
( |
) |
|||||
Common stock repurchased |
|
|
( |
) |
|
|
|
|
|
( |
) |
|
|
|
|
|
|
|
|
|
|
|
( |
) |
|
|
|
|
|
( |
) |
|||||
Vesting of restricted share units |
|
|
|
|
|
|
|
|
|
|
|
|
|
|
|
|
|
|
|
|
|
|
|
|
|
|
|
|||||||||
Issuance of shares to employees |
|
|
|
|
|
|
|
|
|
|
|
|
|
|
|
|
|
|
|
|
|
|
|
|
|
|
|
|||||||||
Net income |
|
|
— |
|
|
|
|
|
|
|
|
|
|
|
|
|
|
|
|
|
|
|
|
|
|
|
|
|
||||||||
Balance at December 31, 2022 |
|
|
|
|
$ |
|
|
$ |
( |
) |
|
$ |
|
|
$ |
|
|
$ |
|
|
$ |
|
|
$ |
|
|
$ |
|
||||||||
Share-based compensation |
|
|
— |
|
|
|
|
|
|
|
|
|
|
|
|
|
|
|
|
|
|
|
|
|
|
|
|
|
||||||||
Transactions with non-controlling |
|
|
— |
|
|
|
|
|
|
|
|
|
( |
) |
|
|
|
|
|
|
|
|
( |
) |
|
|
|
|
|
|
||||||
Distributions to non-controlling interests |
|
|
— |
|
|
|
|
|
|
|
|
|
|
|
|
|
|
|
|
|
|
|
|
|
( |
) |
|
|
( |
) |
||||||
Dividends on redeemable preferred stock |
|
|
— |
|
|
|
|
|
|
|
|
|
|
|
|
|
|
|
( |
) |
|
|
( |
) |
|
|
|
|
|
( |
) |
|||||
Dividends declared (12 cents per share) |
|
|
— |
|
|
|
|
|
|
|
|
|
|
|
|
|
|
|
( |
) |
|
|
( |
) |
|
|
|
|
|
( |
) |
|||||
Common stock repurchased |
|
|
( |
) |
|
|
|
|
|
( |
) |
|
|
|
|
|
|
|
|
|
|
|
( |
) |
|
|
|
|
|
( |
) |
|||||
Vesting and settlement of restricted |
|
|
|
|
|
|
|
|
|
|
|
|
|
|
|
|
|
|
|
|
|
|
|
|
|
|
|
|||||||||
Net income |
|
|
— |
|
|
|
|
|
|
|
|
|
|
|
|
|
|
|
|
|
|
|
|
|
|
|
|
|
||||||||
Balance at December 31, 2023 |
|
|
|
|
$ |
|
|
$ |
( |
) |
|
$ |
|
|
$ |
|
|
$ |
|
|
$ |
|
|
$ |
|
|
$ |
|
||||||||
Share-based compensation |
|
|
— |
|
|
|
|
|
|
|
|
|
|
|
|
|
|
|
|
|
|
|
|
|
|
|
|
|
||||||||
Transactions with non-controlling |
|
|
— |
|
|
|
|
|
|
|
|
|
( |
) |
|
|
|
|
|
|
|
|
( |
) |
|
|
( |
) |
|
|
( |
) |
||||
Dividends on redeemable preferred stock |
|
|
— |
|
|
|
|
|
|
|
|
|
|
|
|
|
|
|
( |
) |
|
|
( |
) |
|
|
|
|
|
( |
) |
|||||
Dividends declared (12 cents per share) |
|
|
— |
|
|
|
|
|
|
|
|
|
|
|
|
|
|
|
( |
) |
|
|
( |
) |
|
|
|
|
|
( |
) |
|||||
Common stock repurchased |
|
|
( |
) |
|
|
|
|
|
( |
) |
|
|
|
|
|
|
|
|
|
|
|
( |
) |
|
|
|
|
|
( |
) |
|||||
Vesting and settlement of restricted |
|
|
|
|
|
|
|
|
|
|
|
|
|
|
|
|
|
|
|
|
|
|
|
|
|
|
|
|||||||||
Issuance of shares |
|
|
|
|
|
|
|
|
|
|
|
|
|
|
|
|
|
|
|
|
|
|
|
|
|
|
|
|||||||||
Net income |
|
|
— |
|
|
|
|
|
|
|
|
|
|
|
|
|
|
|
|
|
|
|
|
|
|
|
|
|
||||||||
Balance at December 31, 2024 |
|
|
|
|
$ |
|
|
$ |
( |
) |
|
$ |
|
|
$ |
|
|
$ |
|
|
$ |
|
|
$ |
|
|
$ |
|
||||||||
The accompanying notes are an integral part of these consolidated financial statements.
F-5
ARKO Corp.
Consolidated Statements of Cash Flows
(in thousands)
|
|
For the Year Ended December 31, |
|
|||||||||
|
|
2024 |
|
|
2023 |
|
|
2022 |
|
|||
Cash flows from operating activities: |
|
|
|
|
|
|
|
|
|
|||
Net income |
|
$ |
|
|
$ |
|
|
$ |
|
|||
Adjustments to reconcile net income to net cash provided by |
|
|
|
|
|
|
|
|
|
|||
Depreciation and amortization |
|
|
|
|
|
|
|
|
|
|||
Deferred income taxes |
|
|
( |
) |
|
|
( |
) |
|
|
|
|
Loss on disposal of assets and impairment charges |
|
|
|
|
|
|
|
|
|
|||
Foreign currency loss |
|
|
|
|
|
|
|
|
|
|||
Gain from issuance of shares as payment of deferred consideration |
|
|
( |
) |
|
|
|
|
|
|
||
Gain from settlement related to business acquisition (see Note 4) |
|
|
( |
) |
|
|
|
|
|
|
||
Amortization of deferred financing costs and debt discount |
|
|
|
|
|
|
|
|
|
|||
Amortization of deferred income |
|
|
( |
) |
|
|
( |
) |
|
|
( |
) |
Accretion of asset retirement obligation |
|
|
|
|
|
|
|
|
|
|||
Non-cash rent |
|
|
|
|
|
|
|
|
|
|||
Charges to allowance for credit losses |
|
|
|
|
|
|
|
|
|
|||
(Income) loss from equity investment |
|
|
( |
) |
|
|
|
|
|
|
||
Share-based compensation |
|
|
|
|
|
|
|
|
|
|||
Fair value adjustment of financial assets and liabilities |
|
|
( |
) |
|
|
( |
) |
|
|
( |
) |
Other operating activities, net |
|
|
|
|
|
|
|
|
|
|||
Changes in assets and liabilities: |
|
|
|
|
|
|
|
|
|
|||
Decrease (increase) in trade receivables |
|
|
|
|
|
( |
) |
|
|
( |
) |
|
Decrease (increase) in inventory |
|
|
|
|
|
( |
) |
|
|
( |
) |
|
Decrease (increase) in other assets |
|
|
|
|
|
( |
) |
|
|
|
||
(Decrease) increase in accounts payable |
|
|
( |
) |
|
|
( |
) |
|
|
|
|
(Decrease) increase in other current liabilities |
|
|
( |
) |
|
|
|
|
|
|
||
Decrease in asset retirement obligation |
|
|
( |
) |
|
|
( |
) |
|
|
( |
) |
Increase in non-current liabilities |
|
|
|
|
|
|
|
|
|
|||
Net cash provided by operating activities |
|
$ |
|
|
$ |
|
|
$ |
|
|||
The accompanying notes are an integral part of these consolidated financial statements.
F-6
ARKO Corp.
Consolidated Statements of Cash Flows (cont’d)
(in thousands)
|
|
For the Year Ended December 31, |
|
|||||||||
|
|
2024 |
|
|
2023 |
|
|
2022 |
|
|||
Cash flows from investing activities: |
|
|
|
|
|
|
|
|
|
|||
Purchase of property and equipment |
|
$ |
( |
) |
|
$ |
( |
) |
|
$ |
( |
) |
Purchase of intangible assets |
|
|
|
|
|
( |
) |
|
|
( |
) |
|
Proceeds from sale of property and equipment |
|
|
|
|
|
|
|
|
|
|||
Business and asset acquisitions, net of cash |
|
|
( |
) |
|
|
( |
) |
|
|
( |
) |
Prepayment for acquisitions |
|
|
|
|
|
( |
) |
|
|
( |
) |
|
Decrease of investments |
|
|
|
|
|
|
|
|
|
|||
Loans to equity investment, net |
|
|
|
|
|
|
|
|
|
|||
Net cash used in investing activities |
|
|
( |
) |
|
|
( |
) |
|
|
( |
) |
Cash flows from financing activities: |
|
|
|
|
|
|
|
|
|
|||
Receipt of long-term debt, net |
|
|
|
|
|
|
|
|
|
|||
Repayment of debt |
|
|
( |
) |
|
|
( |
) |
|
|
( |
) |
Principal payments on financing leases |
|
|
( |
) |
|
|
( |
) |
|
|
( |
) |
Early settlement of deferred consideration related to business acquisition (see Note 4) |
|
|
( |
) |
|
|
|
|
|
|
||
Proceeds from sale-leaseback |
|
|
|
|
|
|
|
|
|
|||
Payment of Additional Consideration |
|
|
( |
) |
|
|
( |
) |
|
|
( |
) |
Payment of Ares Put Option |
|
|
|
|
|
( |
) |
|
|
|
||
Common stock repurchased |
|
|
( |
) |
|
|
( |
) |
|
|
( |
) |
Dividends paid on common stock |
|
|
( |
) |
|
|
( |
) |
|
|
( |
) |
Dividends paid on redeemable preferred stock |
|
|
( |
) |
|
|
( |
) |
|
|
( |
) |
Distributions to non-controlling interests |
|
|
|
|
|
|
|
|
( |
) |
||
Net cash (used in) provided by financing activities |
|
|
( |
) |
|
|
|
|
|
|
||
Net increase (decrease) in cash and cash equivalents and |
|
|
|
|
|
( |
) |
|
|
|
||
Effect of exchange rate on cash and cash equivalents and restricted |
|
|
( |
) |
|
|
|
|
|
( |
) |
|
Cash and cash equivalents and restricted cash, beginning of year |
|
|
|
|
|
|
|
|
|
|||
Cash and cash equivalents and restricted cash, end of year |
|
$ |
|
|
$ |
|
|
$ |
|
|||
Reconciliation of cash and cash equivalents and restricted cash |
|
|
|
|
|
|
|
|
|
|||
Cash and cash equivalents, beginning of year |
|
$ |
|
|
$ |
|
|
$ |
|
|||
Restricted cash, beginning of year |
|
|
|
|
|
|
|
|
|
|||
Cash and cash equivalents and restricted cash, beginning of year |
|
$ |
|
|
$ |
|
|
$ |
|
|||
Cash and cash equivalents, end of year |
|
$ |
|
|
$ |
|
|
$ |
|
|||
Restricted cash, end of year |
|
|
|
|
|
|
|
|
|
|||
Cash and cash equivalents and restricted cash, end of year |
|
$ |
|
|
$ |
|
|
$ |
|
|||
The accompanying notes are an integral part of these consolidated financial statements.
F-7
ARKO Corp.
Consolidated Statements of Cash Flows (cont’d)
(in thousands)
|
|
For the Year Ended December 31, |
|
|||||||||
|
|
2024 |
|
|
2023 |
|
|
2022 |
|
|||
Supplementary cash flow information: |
|
|
|
|
|
|
|
|
|
|||
Cash received for interest |
|
$ |
|
|
$ |
|
|
$ |
|
|||
Cash paid for interest |
|
|
|
|
|
|
|
|
|
|||
Cash received for taxes |
|
|
|
|
|
|
|
|
|
|||
Cash paid for taxes |
|
|
|
|
|
|
|
|
|
|||
Supplementary noncash activities: |
|
|
|
|
|
|
|
|
|
|||
Prepaid insurance premiums financed through notes payable |
|
|
|
|
|
|
|
|
|
|||
Purchases of equipment in accounts payable and accrued expenses |
|
|
|
|
|
|
|
|
|
|||
Purchase of property and equipment under leases |
|
|
|
|
|
|
|
|
|
|||
Disposals of leases of property and equipment |
|
|
|
|
|
|
|
|
|
|||
Issuance of shares as payment of deferred consideration related to business |
|
|
|
|
|
|
|
|
|
|||
Deferred consideration related to business acquisitions |
|
|
|
|
|
|
|
|
|
|||
The accompanying notes are an integral part of these consolidated financial statements.
F-8
ARKO Corp.
Notes to Consolidated Financial Statements
1. General
ARKO Corp. (the “Company”) is a Delaware corporation whose common stock, par value $
The Company’s operations are primarily performed by its wholly owned subsidiary, GPM Investments, LLC, a Delaware limited liability company (“GPM”). Formed in 2002, GPM is engaged directly and through fully owned and controlled subsidiaries in retail activity, which includes the operations of a chain of convenience stores, most of which include adjacent gas stations. GPM is also engaged in wholesale activity, which includes the supply of fuel to gas stations operated by third-parties and, in fleet fueling, which includes the operation of proprietary and third-party cardlock locations (unstaffed fueling locations) and issuance of proprietary fuel cards that provide customers access to a nationwide network of fueling sites. As of December 31, 2024, GPM’s activity included the operation of
The Company has four reportable segments: retail, wholesale, fleet fueling, and GPMP. Refer to Note 23 below for further information with respect to the segments.
2. Summary of Significant Accounting Policies
Basis of Presentation
Accounting Periods
The Company’s fiscal periods end on the last day of the month, and its fiscal year ends on December 31. This results in the Company experiencing fluctuations in current assets and current liabilities due to purchasing and payment patterns which change based upon the day of the week. As a result, working capital can change from period to period not only due to changing business operations, but also due to a change in the day of the week on which a period ends.
Use of Estimates
Foreign Currency Translation
Transactions and balances that are denominated in currencies that differ from the functional currencies have been remeasured into US dollars in accordance with principles set forth in ASC 830, Foreign Currency Matters. At each balance sheet date, monetary items denominated in foreign currencies are translated at exchange rates in effect at the balance sheet date. All exchange gains and losses from the remeasurement mentioned above are reflected in the statement of operations as financial expenses or income, as appropriate.
The revenues of the Company and most of its subsidiaries are generated in US dollars. In addition, most of the costs of the Company and most of its subsidiaries are incurred in US dollars. The Company’s management believes that the US dollar is the primary currency of the economic environment in which the Company and most of its subsidiaries operate. Thus, the functional currency of the Company and most of its subsidiaries is the US dollar.
F-9
For subsidiaries whose functional currency has been determined to be other than the US dollar, assets and liabilities are translated at year-end exchange rates, and statement of operations items are translated at average exchange rates prevailing during the year. Resulting translation differences are recorded as a separate component of accumulated other comprehensive income (loss) in equity.
Cash and Cash Equivalents
Restricted Cash
Trade Receivables
The majority of trade receivables are typically from dealers, fleet fueling customers, customer credit accounts and credit card companies in the ordinary course of business.
At each balance sheet date, the Company recognizes a loss allowance for expected credit losses on trade receivables. The amount of expected credit losses is updated at each reporting date to reflect changes in credit risk since initial recognition of the respective financial instrument. The expected credit losses on trade receivables are estimated based on historical credit loss experience, adjusted for factors that are specific to the debtors, general economic conditions and an assessment of both the current as well as the forecasted direction of conditions at the reporting date, including time value of money where appropriate. The expected credit loss is estimated as the difference between all contractual cash flows that are due to the Company in accordance with the contract and all the cash flows that the Company expects to receive, discounted at the original effective interest rate, as long as the discount impact is material. The Company records an impairment gain or loss in profit or loss for all financial instruments with a corresponding adjustment to their carrying amount through a loss allowance account.
The Company writes off receivable amounts when there is information indicating that the debtor is in severe financial difficulty and there is no realistic prospect of recovery. Financial assets written off may still be subject to enforcement activities under the Company’s recovery procedures, taking into account legal advice where appropriate. Any recoveries made are recognized in profit or loss. The Company has
Inventory
Property and Equipment
Property and equipment are carried at cost or, if acquired through a business combination, at the fair value of the assets as of the acquisition date, less accumulated depreciation and accumulated impairment losses. Expenditures for maintenance and repairs are charged directly to expense when incurred and major improvements are capitalized.
F-10
|
|
Range in Years |
|
|
Buildings and leasehold improvements |
|
|
||
Signs |
|
|
||
Other equipment (primarily office equipment) |
|
|
||
Computers, software and licenses |
|
|
||
Motor vehicles |
|
|
|
|
Fuel equipment |
|
|
||
Equipment in convenience stores |
|
|
||
Impairment of Long-lived Assets
Business Combinations
The Company applies the provisions of ASC 805, Business Combinations, and allocates the fair value of purchase consideration to the tangible and intangible assets acquired, and liabilities assumed based on their estimated fair values. When determining the fair values of assets acquired and liabilities assumed, management makes significant estimates and assumptions, especially with respect to intangible assets. The excess of the fair value of purchase consideration over the fair values of these identifiable assets and liabilities is recorded as goodwill. In subsequent periods, the goodwill is measured at cost less accumulated impairment losses.
If, after reassessment, the net of the acquisition-date amounts of the identifiable assets acquired and liabilities assumed exceeds the sum of the consideration transferred, the excess is recognized immediately within other expenses, net in the consolidated statements of operations as a gain on bargain purchase.
When the consideration transferred in a business combination includes assets or liabilities resulting from a contingent consideration arrangement, the contingent consideration is measured at its acquisition-date fair value and included as part of the consideration transferred in a business combination.
Goodwill and Intangible Assets
Goodwill represents the excess of cost over fair value of net assets of businesses acquired. For the purpose of impairment testing, goodwill is allocated to each reporting unit (or groups of reporting units) expected to benefit from the synergies of the business combination. Intangible assets acquired in a business combination are recorded at fair value as of the date acquired.
|
|
Range in Years |
|
Weighted Average Remaining Amortization Period |
|
||
Goodwill |
|
|
|
||||
Trade names |
|
|
|
|
|||
Wholesale fuel supply contracts |
|
|
|
|
|||
Option to acquire ownership rights |
|
|
|
|
|||
Non-contractual customer relationships |
|
|
|
|
|
||
Liquor licenses |
|
|
|
||||
Franchise rights |
|
|
|
|
|||
Goodwill is reviewed annually on October 1 for impairment, or more frequently if indicators of impairment exist, such as disruptions in the business, unexpected significant declines in operating results or a sustained market capitalization decline. In the
F-11
goodwill impairment test, the reporting unit’s carrying amount (including goodwill) and its fair value are compared. If the estimated fair value of a reporting unit is less than its carrying amount, an impairment charge is recognized for the deficit up to the amount of goodwill recorded.
Non-controlling Interest
These consolidated financial statements reflect the application of ASC 810, Consolidation, which establishes accounting and reporting standards that require: (i) the ownership interest in subsidiaries held by parties other than the parent to be clearly identified and presented in the consolidated balance sheet within shareholders’ equity, but separate from the parent’s equity, (ii) the amount of consolidated net income attributable to the parent and the non-controlling interest to be clearly identified and presented on the face of the consolidated statements of operations, and (iii) changes in a parent’s ownership interest while the parent retains its controlling financial interest in its subsidiary to be accounted for consistently.
A non-controlling interest was previously recorded for the interests owned in the Company’s subsidiary, GPM Petroleum LP (“GPMP”), by the seller in the Company’s 2019 acquisition of
Equity Investment
For equity investments that are not required to be consolidated, the Company evaluates the level of influence it is able to exercise over the investee’s operations to determine whether to use the equity method of accounting. Investees over which the Company determines that the Company has significant influence are accounted for as equity method investment. The Company evaluates its equity method investment for impairment whenever events or changes in circumstances indicate that the carrying amounts of such investment may be impaired.
Since January 2014, the Company has held joint control (
Ligad has granted a third-party an option to purchase certain properties held by it for consideration of approximately $
Fair Value Measurements
Fair value is the price that would be received to sell an asset or paid to transfer a liability in an orderly transaction between market participants at the measurement date (exit price). These valuation techniques involve some level of management estimation and judgment, the degree of which is dependent on the item being valued.
Revenue Recognition
Revenue is recognized when control of the promised goods or services is transferred to the customers. This requires the Company to identify contractual performance obligations and determine whether revenue should be recognized at a single point in time or over time, based on when control of goods and services transfers to a customer. Control is transferred to the customer over time if the customer simultaneously receives and consumes the benefits provided by the Company’s performance. If a performance obligation is not satisfied over time, the Company satisfies the performance obligation at a single point in time.
Revenue is recognized in an amount that reflects the consideration to which the Company expects to be entitled in exchange for goods or services.
F-12
When the Company satisfies a performance obligation by transferring control of goods or services to the customer, revenue is recognized against contract assets in the amount of consideration to which the Company is entitled. When the consideration amount received from the customer exceeds the amounts recognized as revenue, the Company recognizes a contract liability for the excess.
An asset is recognized related to the costs incurred to obtain a contract (e.g. sales commissions) if the costs are specifically identifiable to a contract, the costs will result in enhancing resources that will be used in satisfying performance obligations in the future and the costs are expected to be recovered. These capitalized costs were approximately $
The Company recognizes a contract asset when making upfront incentive payments to dealers. Certain of the upfront considerations represent a prepaid incentive, as these payments are not made for distinct services provided by the dealer. Others represent payments of equipment installed at a dealer location. The prepaid incentives were approximately $
The Company evaluates if it is a principal or an agent in a transaction to determine whether revenue should be recorded on a gross or a net basis. In performing this analysis, the Company considers first whether it controls the goods before they are transferred to the customers and if it has the ability to direct the use of the goods or obtain benefits from them. The Company also considers the following indicators: (1) the primary obligor, (2) the latitude in establishing prices and selecting suppliers, and (3) the inventory risk borne by the Company before and after the goods have been transferred to the customer. When the Company acts as principal, revenue is recorded on a gross basis. When the Company acts as agent, revenue is recorded on a net basis.
Certain fuel and sales taxes are invoiced by fuel suppliers or collected from customers and remitted to governmental agencies either directly, or through suppliers, by the Company. Whether these taxes are presented on a gross or net basis is dependent on whether the Company is acting as a principal or agent in the sales transaction. Fuel excise taxes are presented on a gross basis for fuel sales because the Company is acting as the primary obligor, has pricing latitude, and is also exposed to inventory and credit risks.
Revenue recognition patterns are described below by reportable segment:
Retail
Wholesale
F-13
Fleet Fueling
GPMP
Refer to Note 23 for disclosure of the revenue disaggregated by segment and product line, as well as a description of the reportable segment operations.
Fuel Costs and Merchandise Costs
The Company records discounts and rebates received from suppliers as a reduction of inventory cost if the discount or rebate is based upon purchases or to merchandise costs if the discount relates to product sold. Discounts and rebates conditional upon the volume of the purchases or on meeting certain other goals are included in the consolidated financial statements on a basis relative to the progress toward the goals required to obtain a discount or rebate, as long as receiving the discounts or rebates is reasonably assured and its amount can be reasonably estimated. The estimate of meeting the goals is based, among other things, on contract terms and historical purchases/sales as compared to required purchases/sales.
The Company includes in fuel costs all costs incurred to acquire fuel, including the costs of purchasing and transporting inventory prior to delivery to customers. The Company primarily utilizes third-party carriers to transport fuel inventory to each location. Fuel costs do not include any depreciation of property and equipment as there are no significant amounts that could be attributed to fuel costs. Accordingly, depreciation is separately classified in the consolidated statements of operations.
The Company recognizes merchandise vendor rebates based upon the period of time in which it has completed the unit purchases and/or sales as specified in the merchandise vendor agreements. The Company records such rebates as a reduction of merchandise costs.
Certain upfront amounts paid to the Company by merchandise suppliers and amounts paid to the Company by fuel suppliers for renovation and upgrade costs associated with the rebranding of gas stations are presented as a liability and are recorded to operations as a reduction of merchandise or fuel costs on a straight-line basis relative to the period of the agreement. In the event that the Company does not comply with the conditions of the agreement with the supplier, the Company may be required to repay the unamortized balance of the amount received or grant to the supplier based on the amortization schedule as defined in each applicable agreement. These amounts are classified in other non-current liabilities, except for the current maturity which is classified in other current liabilities.
F-14
Total purchases from suppliers who accounted for 10% or more of total purchases for the periods presented were as follows:
|
|
For the Year Ended December 31, |
|
|||||||||
|
|
2024 |
|
|
2023 |
|
|
2022 |
|
|||
|
|
(in thousands) |
|
|||||||||
Fuel products - Supplier A |
|
$ |
|
|
$ |
|
|
$ |
|
|||
Fuel products - Supplier B |
|
|
|
|
|
|
|
|
|
|||
Fuel products - Supplier C |
|
* |
|
|
|
|
|
|
|
|||
Merchandise products - Supplier D |
|
|
|
|
|
|
|
|
|
|||
* Purchases did not exceed
Environmental Costs
Advertising Costs
Income Taxes
Income taxes are accounted for under the provisions of ASC 740, Income Taxes. Current and deferred taxes are recognized in profit or loss, except when they arise from the initial accounting for a business acquisition, in which case the tax effect is included in the accounting for the business acquisition. The current tax is calculated using tax rates that have been enacted or substantively enacted by the balance sheet date. Deferred tax is provided using the asset and liability method on temporary differences arising between the tax bases of assets and liabilities and their carrying amounts. Deferred tax assets are recognized for future tax benefits and credit carryforwards to the extent that it is probable that future taxable profit will be available against which the temporary differences can be utilized. The carrying amount of deferred tax assets is reviewed at each balance sheet date. Deferred tax liabilities are not recognized if the temporary difference arises from the initial recognition of goodwill. Deferred tax liabilities and assets are measured at the tax rates that are expected to apply in the period in which the liability is settled or the asset realized, based on the tax rates (and tax laws) that have been enacted by the end of the reporting periods. After determining the total amount of deferred tax assets, a determination is made as to whether it is more likely than not that some portion of the deferred tax assets will not be realized. If it is determined that a deferred tax asset is not likely to be realized, a valuation allowance is established. Deferred tax assets and deferred tax liabilities are offset if the Company had a legally enforceable right to offset current tax assets against current tax liabilities and the deferred tax relates to the same taxable entity and the same tax authority.
Uncertain tax positions meeting the more likely than not recognition threshold are measured and recognized in the consolidated financial statements at the largest amount of benefit that has a greater than
Derivative Instruments and Hedging Activities
The Company accounts for financial derivative instruments at fair value and applies hedge accounting rules when applicable. The Company utilizes derivative instruments related to ultra-low sulfur diesel to offset changes in the fair value of its firm commitments to purchase diesel fuel that is ultimately delivered to certain of its fleet fueling sites and certain of its dealer locations.
These instruments are accounted for as fair value hedges of a firm commitment upon proper qualification. The Company assesses at inception and on an ongoing basis whether a derivative instrument accounted for as a hedge is highly effective in offsetting changes in the fair value of the hedged item (that is, the unrecognized firm commitment). The gain or loss on the hedging instrument is recognized currently in earnings within fuel costs in the consolidated statement of operations, for the period in which the changes in fair value occur. The gain or loss (that is, the change in fair value) on the hedged item attributable to the hedged risk designated as being hedged adjusts the carrying amount of the related hedged item and is simultaneously recognized in earnings within fuel costs in
F-15
the consolidated statement of operations, as an adjustment to the carrying amount of that hedged item (that is, the Company recognizes as assets or liabilities the changes in the fair value of the firm commitment that are attributable to the risk being hedged and that arise while the hedge of the firm commitment exists). When the underlying assets are purchased in accordance with the terms of the hedged firm commitment, the initial cost basis in the acquired assets is adjusted by the amount of the firm commitment that was recognized as an asset or liability under the fair value hedging model. See Note 21 and Note 22 for further information about the Company’s derivatives.
Earnings Per Share
Basic earnings per share are calculated in accordance with ASC 260, Earnings Per Share, by dividing net income (loss) attributable to the Company by the weighted average number of common shares outstanding during the year. Diluted earnings per share are calculated, if applicable, by adjusting net income (loss) attributable to the Company and the weighted average number of common shares, taking into effect all potential dilutive common shares.
Share-Based Compensation
ASC 718, Compensation – Stock Compensation, requires the cost of all share-based payments to employees to be recognized in the statement of operations and establishes fair value as the measurement objective in accounting for share-based payment arrangements. ASC 718 requires the use of a valuation model to calculate the fair value of stock-based awards on the date of grant.
Restricted share units are valued based on the fair market value of the underlying stock on the date of grant. The Company records compensation expense for these awards based on the grant date fair value of the award, recognized ratably over the vesting period of the award. Additionally, certain awards include performance and market conditions. For awards with performance conditions, share-based compensation expense is estimated based on the probable outcome of shares to be awarded adjusted as necessary at each reporting period.
The Company recognizes compensation expense related to stock-based awards with graded vesting on a straight-line basis over the vesting period. The Company’s share-based compensation expense is adjusted for forfeitures when they are incurred.
Employee Benefits
Leases
The Company as Lessee
The Company assesses whether a contract is, or contains, a lease at inception of the contract. A contract contains a lease on the basis of whether the Company has the right to control the use of an identified asset for a period of time in exchange for consideration. While assessing whether a contract conveys the right to control the use of an identified asset, the Company assesses whether, throughout the period of use, it has both of the following:
The lease term is the non-cancellable period of a lease together with periods covered by an option to extend the lease if the Company is reasonably certain it will exercise that option.
In assessing the lease term, the Company takes into account extension options that, at initial recognition, it is reasonably certain that it will exercise. The likelihood of the exercise of the extension options is examined considering, among other things, the lease payments during the extension periods in relation to the market prices, significant improvements in the leased properties that are expected to have a significant economic benefit during the extension period, actual profitability characteristics and expected profitability of the sites, the remaining non-cancellable period, the number of years under the extension periods, location of the leased property and the availability of suitable alternatives.
F-16
Because the interest rate implicit in the lease cannot be readily determined, the Company generally utilizes the incremental borrowing rates of the Company. These rates are defined as the interest rates that the Company would have to pay, on the commencement date of the lease, to borrow, over a similar term and with a similar security, the funds necessary to obtain an asset of a similar value to the right-of-use asset in the lease agreement and in a similar economic environment.
Lease payments included in the measurement of the lease liability consist of:
Variable rents that do not depend on an index or rate and which are not in-substance fixed lease payments (for example, payments that are determined as a percentage of sales) are not included in the measurement of the lease liability and the right-of-use asset. The related payments are recognized as an expense in the period in which the event or condition that triggers those payments occurs and are included in site operating expenses in the statements of operations.
For variable lease payments that depend on an index or a rate (such as the consumer price index or a market interest rate), on the commencement date, the lease payments were initially measured using the index or rate at the commencement date. The Company does not remeasure the lease liability for changes in future lease payments arising from changes in an index or rate unless the lease liability is remeasured for another reason. Therefore, after initial recognition, such variable lease payments are recognized in statements of operations as they are incurred.
The Company determines if the lease is an operating lease or a financing lease and recognizes right-of-use assets and lease liabilities for all leases, except for short-term leases (lease term of one year or less) and leases of low value assets. For these leases, the Company recognizes lease expense on a straight-line basis over the lease term.
At the commencement date, the lease liability is measured at the present value of future lease payments that are not paid at that date (not including payments made at the commencement date of the lease), discounted generally using the relevant incremental borrowing rate, and presented as a separate line item in the consolidated balance sheets. The operating lease liability is subsequently remeasured each period at the present value of future lease payments that are not paid at that date. The financing lease liability is subsequently measured by increasing the carrying amount to reflect interest on the lease liability (using the effective interest method) and by reducing the carrying amount to reflect the lease payments made.
Some of the lease agreements include an increase in the consumer price index coupled with a multiplier and a percentage increase cap effectively assures the cap will be reached each year. The Company determined, based on past experience and consumer price index increase expectations, that these types of variable payments are in-substance fixed payments and such payments are included in the measurement of the lease liabilities as of the date of the initial lease liability measurement.
The Company remeasures the lease liability (and makes corresponding adjustments to the related right-of-use asset) whenever the following occurs:
The right-of-use asset is measured at cost and presented as a separate line item in the consolidated balance sheets. The cost of the right-of-use asset comprises the initial measurement of the corresponding lease liability, lease payments made at or before the commencement date, and any initial direct costs. In business combinations, the amount is adjusted to reflect favorable or unfavorable terms of the lease relative to market terms. Subsequently, the right-of-use asset under operating leases is measured at the carrying amount of the lease liability, adjusted for prepaid or accrued lease payments, unamortized lease incentives received and accumulated impairment losses. The right-of-use asset under financing leases is measured at cost less accumulated depreciation and accumulated impairment losses.
F-17
Whenever the Company incurs an obligation for costs (either on the commencement date or consequently) to dismantle and remove a leased asset, restore the site on which it is located, or restore the underlying asset to the condition required by the terms and conditions of the lease, a provision is recognized. The costs are included in the related right-of-use asset.
Right-of-use assets under financing leases are depreciated based on the straight-line method over the shorter period of the lease term and the useful life of the underlying asset, with weighted average depreciation periods as follows:
|
|
Years |
|
|
Leasehold improvements, buildings and real estate assets |
|
|
|
|
Equipment |
|
|
|
|
If the lease transfers ownership of the underlying asset to the Company by the end of the lease term or if the cost of the right-of-use asset reflects that the Company will exercise a purchase option, the Company will depreciate the right-of-use asset from the commencement date to the end of the useful life of the underlying asset.
The Company adjusts the right-of-use asset and as a result, the depreciation period in the following periods, if it remeasures the respective lease liability.
The Company as Lessor
Leases for which the Company is a lessor are classified as sales-type, direct financing or operating leases. When the Company is an intermediate lessor, it accounts for the head lease and the sublease as separate contracts. The sublease is classified as a sales-type, direct financing or operating lease by reference to the head lease’s underlying asset.
Whenever the terms of the lease transfer substantially all the risks and rewards incidental to ownership to the lessee, the contract is classified as a sales-type, or direct financing. All other leases are classified as operating leases.
Rental income from operating leases is recognized on a straight-line basis over the term of the relevant lease. For a sublease that is classified as an operating lease, the right-of-use asset related to the head lease or the fixed asset is not derecognized, and the Company continues to depreciate the leased asset over its useful life. Initial direct costs incurred in negotiating and arranging an operating lease are added to the carrying amount of the leased asset and depreciated on a straight-line basis over the lease term. Rental income on leased and subleased property to dealers and other third-parties is recognized on a straight-line basis based upon the term of the tenant’s lease or sublease.
New Accounting Pronouncements
Segment Reporting – In November 2023, the FASB issued Accounting Standards Update (“ASU”) No. 2023-07, Segment Reporting (topic 280): Improvements to Reportable Segment Disclosures. The amendments improve reportable segment disclosure requirements, primarily through enhanced disclosures about significant segment expenses. In addition, the amendments enhance interim disclosure requirements, clarify circumstances in which an entity can disclose multiple segment measures of profit or loss, provide new segment disclosure requirements for entities with a single reportable segment, and contain other disclosure requirements. The enhanced segment disclosure requirements apply retrospectively to all prior periods presented in the financial statements. The amendments in ASU 2023-07 are effective for annual periods beginning January 1, 2024, and interim periods beginning on January 1, 2025 for the Company. The Company has adopted this standard for its consolidated financial statements.
New Accounting Pronouncements Not Yet Adopted
Expense Disaggregation Disclosures – In November 2024, the FASB issued ASU 2024-03, Income Statement – Reporting Comprehensive Income - Expense Disaggregation Disclosures (Subtopic 220-40): Disaggregation of Income Statement Expenses, which requires additional disclosure of the nature of expenses included in the income statement. The standard requires disclosures about specific types of expenses included in the expense captions presented in the income statement. This ASU is effective for fiscal years beginning after December 15, 2026, and interim periods beginning after December 15, 2027, with early adoption permitted. The requirements should be applied on a prospective basis while retrospective application is permitted. The Company is currently evaluating the impact that the adoption of this standard will have on its disclosures.
F-18
3. Limited Partnership
GPMP commenced its operation in January 2016, and thereafter the following has applied:
The Riiser Seller owed GPM approximately $
4. Acquisitions
SpeedyQ Acquisition
On April 9, 2024, the Company acquired certain assets from a third-party, including
Transit Energy Group, LLC
On
The Company paid approximately $
F-19
Pursuant to the TEG Purchase Agreement, on March 1, 2024, the Company issued
On March 26, 2024, the Company and TEG entered into a second amendment to the TEG Purchase Agreement (the “TEG Purchase Agreement Amendment”), pursuant to which, in full satisfaction of all Installment Payments, (i) the Company repurchased the First Installment Shares from TEG for an aggregate purchase price of approximately $
The details of the TEG Acquisition were as follows:
|
|
Amount |
|
|
|
|
(in thousands) |
|
|
Fair value of consideration transferred: |
|
|
|
|
Cash |
|
$ |
|
|
GPMP Capital One Line of Credit |
|
|
|
|
Liability resulting from deferred purchase price |
|
|
|
|
Receivable from TEG |
|
|
( |
) |
Consideration provided by Blue Owl |
|
|
|
|
Total consideration |
|
$ |
|
|
Assets acquired and liabilities: |
|
|
|
|
Cash and cash equivalents |
|
$ |
|
|
Inventory |
|
|
|
|
Other assets |
|
|
|
|
Property and equipment, net |
|
|
|
|
Intangible assets |
|
|
|
|
Right-of-use assets under operating leases |
|
|
|
|
Environmental receivables |
|
|
|
|
Deferred tax asset |
|
|
|
|
Total assets |
|
|
|
|
Other liabilities |
|
|
( |
) |
Environmental liabilities |
|
|
( |
) |
Asset retirement obligations |
|
|
( |
) |
Operating leases |
|
|
( |
) |
Total liabilities |
|
|
( |
) |
Total identifiable net assets |
|
|
|
|
Goodwill |
|
$ |
|
|
|
|
|
|
|
Consideration paid in cash by the Company |
|
$ |
|
|
Consideration provided by Blue Owl |
|
|
|
|
Less: cash and cash equivalent balances acquired |
|
|
( |
) |
Net cash outflow |
|
$ |
|
|
The Company included identifiable tangible and intangible assets and identifiable liabilities at their respective fair values based on the information available to the Company’s management on the TEG Acquisition closing date, including, among other things, a
F-20
valuation performed by external consultants. Specifically, the valuation of the wholesale fuel supply contracts was performed by an external consultant using the income approach with a weighted average discount rate of
As a result of the accounting treatment of the TEG Acquisition, the Company recorded goodwill of approximately $
Acquisition-related costs of approximately $
Results of operations for the TEG Acquisition for the period subsequent to the acquisition closing date were included in the consolidated statement of operations for the year ended December 31, 2023. For the period from the TEG Acquisition closing date through December 31, 2023, the Company recognized $
WTG Fuels Holdings, LLC
On
The purchase price for the WTG Acquisition was approximately $
The details of the WTG Acquisition were as follows:
F-21
|
|
Amount |
|
|
|
|
(in thousands) |
|
|
Fair value of consideration transferred: |
|
|
|
|
Cash |
|
$ |
|
|
GPMP Capital One Line of Credit |
|
|
|
|
Consideration provided by Blue Owl |
|
|
|
|
Total consideration |
|
$ |
|
|
Assets acquired and liabilities: |
|
|
|
|
Cash and cash equivalents |
|
$ |
|
|
Inventory |
|
|
|
|
Other assets |
|
|
|
|
Property and equipment, net |
|
|
|
|
Intangible assets |
|
|
|
|
Right-of-use assets under operating leases |
|
|
|
|
Environmental receivables |
|
|
|
|
Deferred tax asset |
|
|
|
|
Total assets |
|
|
|
|
Other liabilities |
|
|
( |
) |
Environmental liabilities |
|
|
( |
) |
Asset retirement obligations |
|
|
( |
) |
Operating leases |
|
|
( |
) |
Total liabilities |
|
|
( |
) |
Total identifiable net assets |
|
|
|
|
Goodwill |
|
$ |
|
|
|
|
|
|
|
Consideration paid in cash by the Company |
|
$ |
|
|
Consideration provided by Blue Owl |
|
|
|
|
Less: cash and cash equivalent balances acquired |
|
|
( |
) |
Net cash outflow |
|
$ |
|
|
The Company included identifiable tangible and intangible assets and identifiable liabilities at their respective fair values based on the information available to the Company’s management on the WTG Acquisition closing date, including, among other things, a valuation performed by external consultants. The useful life of the customer relationships related to the proprietary cardlock sites and the proprietary fuel cards that give customers access to a nationwide network of fueling sites was estimated at
In 2024, the Company finalized the accounting treatment of the WTG Acquisition, including the valuation of some of the assets acquired, liabilities assumed and the goodwill resulting from the acquisition. As a result, the Company primarily reduced property and equipment by approximately $
As a result of the accounting treatment of the WTG Acquisition, the Company recorded goodwill of approximately $
Acquisition-related costs of approximately $
Results of operations for the WTG Acquisition for the period subsequent to the acquisition closing date were included in the consolidated statement of operations for the year ended December 31, 2023. For the period from the WTG Acquisition closing date through December 31, 2023, the Company recognized $
Speedy’s Acquisition
On August 15, 2023, the Company acquired from a third-party
F-22
acquisition, the Company had supplied fuel to these sites, which had been operated by a dealer. The consideration at closing was approximately $
Quarles Acquisition
On
The total consideration for the Quarles Acquisition as set forth in the purchase agreement was approximately $
The details of the Quarles Acquisition were as follows:
|
|
Amount |
|
|
|
|
(in thousands) |
|
|
Fair value of consideration transferred: |
|
|
|
|
Cash |
|
$ |
|
|
GPMP Capital One Line of Credit |
|
|
|
|
Liability resulting from contingent consideration |
|
|
|
|
Consideration provided by Blue Owl |
|
|
|
|
Total consideration |
|
$ |
|
|
Assets acquired and liabilities: |
|
|
|
|
Inventory |
|
$ |
|
|
Other assets |
|
|
|
|
Property and equipment, net |
|
|
|
|
Right-of-use assets under operating leases |
|
|
|
|
Intangible assets |
|
|
|
|
Environmental receivables |
|
|
|
|
Total assets |
|
|
|
|
Other liabilities |
|
|
( |
) |
Environmental liabilities |
|
|
( |
) |
Asset retirement obligations |
|
|
( |
) |
Operating leases |
|
|
( |
) |
Total liabilities |
|
|
( |
) |
Total identifiable net assets |
|
|
|
|
Goodwill |
|
$ |
|
|
|
|
|
|
|
Consideration paid in cash by the Company |
|
$ |
|
|
Consideration provided by Blue Owl |
|
|
|
|
Net cash outflow |
|
$ |
|
|
The Company included identifiable tangible and intangible assets and identifiable liabilities at their respective fair values based on the information available to the Company’s management on the Quarles Acquisition closing date, including, among other things, a
F-23
valuation performed by external consultants. The useful life of the wholesale fuel supply contracts was
The Company’s accounting treatment of the Quarles Acquisition resulted in no goodwill being recorded.
Acquisition-related costs of approximately $
Results of operations for the Quarles Acquisition for the period subsequent to the acquisition closing date were reflected in the consolidated statement of operations for the year ended December 31, 2022. For the period from the Quarles Acquisition closing date through December 31, 2022, the Company recognized $
Pride Convenience Holdings, LLC Acquisition
On December 6, 2022, the Company acquired all of the issued and outstanding membership interests in Pride Convenience Holdings, LLC (“Pride”), which operates
The total purchase price for the Pride Acquisition was approximately $
The details of the Pride Acquisition were as follows:
F-24
|
|
Amount |
|
|
|
|
(in thousands) |
|
|
Fair value of consideration transferred: |
|
|
|
|
Cash |
|
$ |
|
|
GPMP Capital One Line of Credit |
|
|
|
|
Payable to Pride Parent, LLC |
|
|
|
|
Consideration provided by Blue Owl |
|
|
|
|
Total consideration |
|
$ |
|
|
Assets acquired and liabilities: |
|
|
|
|
Cash and cash equivalents |
|
$ |
|
|
Trade receivables |
|
|
|
|
Inventory |
|
|
|
|
Other assets |
|
|
|
|
Property and equipment |
|
|
|
|
Right-of-use assets under operating leases |
|
|
|
|
Intangible assets |
|
|
|
|
Environmental receivables |
|
|
|
|
Deferred tax asset |
|
|
|
|
Total assets |
|
|
|
|
Accounts payable |
|
|
( |
) |
Other liabilities |
|
|
( |
) |
Environmental liabilities |
|
|
( |
) |
Asset retirement obligations |
|
|
( |
) |
Operating leases |
|
|
( |
) |
Total liabilities |
|
|
( |
) |
Total identifiable net assets |
|
|
|
|
Goodwill |
|
$ |
|
|
|
|
|
|
|
Consideration paid in cash by the Company |
|
$ |
|
|
Consideration provided by Blue Owl |
|
|
|
|
Less: cash and cash equivalent balances acquired |
|
|
( |
) |
Net cash outflow |
|
$ |
|
|
The Company included identifiable tangible and intangible assets and identifiable liabilities at their respective fair values based on the information available to the Company’s management on the Pride Acquisition closing date, including, among other things, a valuation performed by external consultants. The useful life of the trade name was
As a result of the accounting treatment of the Pride Acquisition, the Company recorded goodwill of approximately $
Acquisition-related costs of approximately $
Results of operations for the Pride Acquisition for the period subsequent to the acquisition closing date were reflected in the consolidated statement of operations for the year ended December 31, 2022. For the period from the Pride Acquisition closing date through December 31, 2022, the Company recognized $
Impact of Business Combinations (unaudited)
The unaudited supplemental pro forma financial information presented below was prepared based on the historical information of the Company and the acquired operations and gives pro forma effect to the acquisitions using the assumption that the 2023 Acquisitions and the 2022 Acquisitions had occurred on January 1, 2022. The unaudited supplemental pro forma financial information does not give effect to the potential impact of current financial conditions, any anticipated synergies, operating efficiencies or cost savings that may result from the acquisitions or any integration costs.
F-25
indicative of what the actual results of operations would have been had these business combinations occurred on January 1, 2022 nor is it indicative of future results.
|
|
For the Year Ended December 31, |
|
|||||||||
|
|
2024 |
|
|
2023 |
|
|
2022 |
|
|||
|
|
(unaudited) |
|
|||||||||
|
|
(in thousands) |
|
|||||||||
Total revenue |
|
$ |
|
|
$ |
|
|
$ |
|
|||
Net income |
|
|
|
|
|
|
|
|
|
|||
5. Trade Receivables, Net
Trade receivables consisted of the following:
|
|
As of December 31, |
|
|||||
|
|
2024 |
|
|
2023 |
|
||
|
|
(in thousands) |
|
|||||
Credit card receivables |
|
$ |
|
|
$ |
|
||
Fleet fueling customer credit accounts receivables, net |
|
|
|
|
|
|
||
Dealers and customer credit accounts receivables, net |
|
|
|
|
|
|
||
Total trade receivables, net |
|
$ |
|
|
$ |
|
||
An allowance for credit losses is provided based on management’s evaluation of outstanding accounts receivable. The Company had reserved $
6. Inventory
Inventory consisted of the following:
|
|
As of December 31, |
|
|||||
|
|
2024 |
|
|
2023 |
|
||
|
|
(in thousands) |
|
|||||
Fuel inventory |
|
$ |
|
|
$ |
|
||
Merchandise inventory |
|
|
|
|
|
|
||
Lottery inventory |
|
|
|
|
|
|
||
Total inventory |
|
$ |
|
|
$ |
|
||
Merchandise inventory consisted primarily of cigarettes, other tobacco products, beer, wine, non-alcoholic drinks, candy, snacks, dairy products, prepackaged food and other grocery items.
7. Other Current Assets
Other current assets consisted of the following:
|
|
As of December 31, |
|
|||||
|
|
2024 |
|
|
2023 |
|
||
|
|
(in thousands) |
|
|||||
Vendor receivables |
|
$ |
|
|
$ |
|
||
Asset resulting from contingent consideration |
|
|
|
|
|
|
||
Prepaid expenses |
|
|
|
|
|
|
||
Environmental receivables |
|
|
|
|
|
|
||
Income tax receivable |
|
|
|
|
|
|
||
Due from related parties |
|
|
|
|
|
|
||
Other current assets |
|
|
|
|
|
|
||
Total other current assets |
|
$ |
|
|
$ |
|
||
F-26
8. Property and Equipment, Net
Property and equipment consisted of the following:
|
|
As of December 31, |
|
|||||
|
|
2024 |
|
|
2023 |
|
||
|
|
(in thousands) |
|
|||||
Land |
|
$ |
|
|
$ |
|
||
Buildings and leasehold improvements |
|
|
|
|
|
|
||
Equipment |
|
|
|
|
|
|
||
Accumulated depreciation |
|
|
( |
) |
|
|
( |
) |
Total property and equipment, net |
|
$ |
|
|
$ |
|
||
As of December 31, 2024 and 2023, the table above included $
Depreciation expense was $
Standby Real Estate Program
On
Pursuant to and subject to the terms of the Program Agreement, from May 2, 2023 through September 30, 2025, subject to certain early termination events, Blue Owl has agreed to purchase up to $
Pursuant to the Program Agreement, upon any acquisition of a Property by Blue Owl, or an affiliate thereof, GPM, or an affiliate thereof, would enter into a triple-net lease agreement with Blue Owl or such affiliate pursuant to which GPM or such affiliate would lease such Property from Blue Owl or such affiliate based upon commercial terms contained in the Program Agreement. The purchase price for any Property would similarly be subject to commercial terms agreed upon by GPM and Blue Owl in the Program Agreement and if in connection with the acquisition of convenience stores and gas stations from third-parties, consistent with the agreed upon purchase price or designation rights with the seller of the real estate. During the program term, GPM may not sell or designate any Property pursuant to a sale-leaseback or similar transaction without first offering such Property to Blue Owl in accordance with the terms and conditions of the Program Agreement. Certain Properties specified by GPM are not subject to the foregoing right of first offer, and the Program Agreement does not obligate GPM to sell any Property, or acquire any property from a third-party for purposes of its sale, to Blue Owl or assign the right to acquire the third-party’s real estate to Blue Owl, unless GPM elects, in its sole discretion, to enter into a sale-leaseback, designation or similar transaction governed by the Program Agreement.
9. Goodwill and Intangible Assets
Goodwill
The Company reports revenue and operating results for its operating segments: retail, wholesale, fleet fueling and GPMP (see Note 23 for a description of these operating segments).
|
|
Retail |
|
|
GPMP |
|
|
Total |
|
|||
|
|
(in thousands) |
|
|||||||||
Beginning balance, January 1, 2023 |
|
$ |
|
|
$ |
|
|
$ |
|
|||
Goodwill attributable to acquisitions during the year |
|
|
|
|
|
|
|
|
|
|||
Goodwill adjustment – Pride Acquisition |
|
|
|
|
|
|
|
|
|
|||
Ending balance, December 31, 2023 |
|
$ |
|
|
$ |
|
|
$ |
|
|||
Goodwill adjustment – WTG Acquisition |
|
|
|
|
|
|
|
|
|
|||
Ending balance, December 31, 2024 |
|
$ |
|
|
$ |
|
|
$ |
|
|||
F-27
Intangible Assets, Net
Intangible assets consisted of the following:
|
|
As of December 31, |
|
|||||
|
|
2024 |
|
|
2023 |
|
||
|
|
(in thousands) |
|
|||||
Wholesale fuel supply agreements |
|
$ |
|
|
$ |
|
||
Trade names |
|
|
|
|
|
|
||
Options to acquire ownership rights |
|
|
|
|
|
|
||
Non-contractual customer relationships |
|
|
|
|
|
|
||
Other intangibles |
|
|
|
|
|
|
||
Accumulated amortization – Wholesale fuel supply agreements |
|
|
( |
) |
|
|
( |
) |
Accumulated amortization – Trade names |
|
|
( |
) |
|
|
( |
) |
Accumulated amortization – Options to acquire ownership rights |
|
|
( |
) |
|
|
( |
) |
Accumulated amortization – Non-contractual customer relationships |
|
|
( |
) |
|
|
( |
) |
Accumulated amortization – Other intangibles |
|
|
( |
) |
|
|
( |
) |
|
|
$ |
|
|
$ |
|
||
Franchise rights and liquor licenses of $
Amortization expense related to definite lived intangible assets was $
Estimated amortization expense for each of the next five years and thereafter is expected to be as follows:
Future Amortization Expense |
|
Amount |
|
|
|
|
(in thousands) |
|
|
2025 |
|
$ |
|
|
2026 |
|
|
|
|
2027 |
|
|
|
|
2028 |
|
|
|
|
2029 |
|
|
|
|
Thereafter |
|
|
|
|
|
|
$ |
|
|
F-28
10. Other Current Liabilities
The components of other current liabilities were as follows:
|
|
As of December 31, |
|
|||||
|
|
2024 |
|
|
2023 |
|
||
|
|
(in thousands) |
|
|||||
Accrued employee costs |
|
$ |
|
|
$ |
|
||
Fuel and other taxes |
|
|
|
|
|
|
||
Accrued insurance liabilities |
|
|
|
|
|
|
||
Accrued expenses |
|
|
|
|
|
|
||
Environmental liabilities |
|
|
|
|
|
|
||
Deferred vendor income |
|
|
|
|
|
|
||
Accrued income taxes payable |
|
|
|
|
|
|
||
Dealer deposits |
|
|
|
|
|
|
||
Liabilities resulting from Additional Consideration and Contingent Consideration |
|
|
|
|
|
|
||
Deferred payments related to acquisitions (see Note 4) |
|
|
|
|
|
|
||
Public Warrants |
|
|
|
|
|
|
||
Private Warrants |
|
|
|
|
|
|
||
Financial liabilities |
|
|
|
|
|
|
||
Other accrued liabilities |
|
|
|
|
|
|
||
Total other current liabilities |
|
$ |
|
|
$ |
|
||
Additional Consideration and Contingent Consideration
Part of the consideration to the sellers in the acquisition of the business of Empire Petroleum Partners, LLC (“Empire”) in 2020 was as follows:
Public and Private Warrants
As of December 31, 2024, there were
The Company may redeem not less than all of the outstanding Public Warrants:
F-29
If the Company calls the Public Warrants for redemption as described above, the Company’s management will have the option to require any holder that wishes to exercise its warrant to do so on a “cashless basis.”
The Private Warrants will not be redeemable by the Company so long as they are held by certain of the Haymaker Founders (as defined in Note 17 below) or their permitted transferees. Otherwise, the Private Warrants have terms and provisions that are substantially identical to those of the Public Warrants, including as to exercise price, exercisability and exercise period. If the Private Warrants are held by holders other than certain of the Haymaker Founders or its permitted transferees, the Private Warrants will be redeemable by the Company and exercisable by the holders on the same basis as the Public Warrants.
Financial Liabilities
The current and non-current portions of financial liabilities are related to off-market sale-leaseback transactions with Blue Owl related to the 2023 Acquisitions of TEG and WTG, the 2022 Acquisitions of Quarles and Pride, as further described in Note 4 above, and a failed sale-leaseback transaction related to the 2021 acquisition of ExpressStop convenience stores.
11. Other Non-current Liabilities
The components of other non-current liabilities were as follows:
|
|
As of December 31, |
|
|||||
|
|
2024 |
|
|
2023 |
|
||
|
|
(in thousands) |
|
|||||
Environmental liabilities |
|
$ |
|
|
$ |
|
||
Deferred vendor income |
|
|
|
|
|
|
||
Liabilities resulting from Additional Consideration and Contingent Consideration |
|
|
|
|
|
|
||
Deferred payments related to acquisitions (see Note 4) |
|
|
|
|
|
|
||
Public Warrants |
|
|
|
|
|
|
||
Private Warrants |
|
|
|
|
|
|
||
Additional Deferred Shares |
|
|
|
|
|
|
||
Financial liabilities (see Note 10) |
|
|
|
|
|
|
||
Other non-current liabilities |
|
|
|
|
|
|
||
Total other non-current liabilities |
|
$ |
|
|
$ |
|
||
12. Debt
The components of debt were as follows:
|
|
As of December 31, |
|
|||||
|
|
2024 |
|
|
2023 |
|
||
|
|
(in thousands) |
|
|||||
Senior Notes |
|
$ |
|
|
$ |
|
||
M&T debt |
|
|
|
|
|
|
||
Capital One Line of Credit |
|
|
|
|
|
|
||
Insurance premium notes |
|
|
|
|
|
|
||
Total debt, net |
|
$ |
|
|
$ |
|
||
Less current portion |
|
|
( |
) |
|
|
( |
) |
Total long-term debt, net |
|
$ |
|
|
$ |
|
||
F-30
Financing Agreements
Type of financing |
Original principal amount of |
Financing payment terms |
Interest rate |
Interest |
Amount |
|
Balance as |
|
||
ARKO Corp. |
|
|||||||||
Senior Notes |
$ |
Fixed rate |
$ |
|
$ |
|
||||
GPM Investments, LLC |
|
|||||||||
PNC Line of Credit |
Up to $ |
For revolving advances that are Term SOFR Loans: SOFR Adjusted plus Term SOFR (as defined in the agreement) plus |
None |
|
|
|||||
M&T Term Loans |
$ |
$ |
SOFR (as defined in the agreement) plus |
$ |
|
$ |
|
|||
M&T Equipment Line of Credit |
Up to $ |
|
Fixed rate |
$ |
|
$ |
|
|||
Other M&T Term Loans |
$ |
Fixed and variable rate |
$ |
|
$ |
|
||||
GPMP |
|
|||||||||
Capital One Line of Credit |
Up to $ |
For SOFR Loans: Adjusted Term SOFR (as defined in the agreement) plus |
$ |
|
$ |
|
||||
Total |
|
|
|
|
|
|
$ |
|
||
F-31
Senior Notes
The indenture governing the Senior Notes contains customary restrictive covenants that, among other things, generally limit the ability of the Company and substantially all of its subsidiaries to (i) create liens, (ii) pay dividends, acquire shares of capital stock and make payments on subordinated debt, (iii) place limitations on distributions from certain subsidiaries, (iv) issue or sell the capital stock of certain subsidiaries, (v) sell assets, (vi) enter into transactions with affiliates, (vii) effect mergers and (viii) incur indebtedness.
The Senior Notes and the guarantees rank equally in right of payment with all of the Company’s and the Guarantors’ respective existing and future senior unsubordinated indebtedness and are effectively subordinated to all of the Company’s and the Guarantors’ existing and future secured indebtedness to the extent of the value of the collateral securing such indebtedness; and are structurally subordinated to any existing and future obligations of subsidiaries of the Company that are not Guarantors.
Financing Agreement with PNC Bank, National Association (“PNC”)
GPM and certain subsidiaries have a financing arrangement with PNC (as amended, the “PNC Credit Agreement”) that provides a line of credit for purposes of financing working capital (the “PNC Line of Credit”). The calculation of the availability under the PNC Credit Agreement is determined monthly subject to terms and limitations as set forth in the PNC Credit Agreement, taking into account the balances of receivables, inventory and letters of credit, among other things. PNC has a first priority lien on receivables, inventory and rights in bank accounts (other than assets that cannot be pledged due to regulatory or contractual obligations).
The PNC Line of Credit contains customary restrictive covenants and events of default.
M&T Bank Credit Agreement
On November 21, 2023, GPM further amended and restated the M&T Credit Agreement to increase the aggregate principal amount of real estate loans from $
The Company has granted a mortgage in the real estate of
Financing Agreement with a Syndicate of Banks led by Capital One, National Association
GPMP has a revolving credit facility with a syndicate of banks led by Capital One, National Association, with an aggregate principal amount of availability thereunder of $
F-32
The Capital One Line of Credit is available for general partnership purposes, including working capital, capital expenditures and permitted acquisitions. All borrowings and letters of credit under the Capital One Line of Credit are subject to the satisfaction of certain customary conditions, including the absence of any default or event of default and the accuracy of representations and warranties. The Capital One Line of Credit is secured by substantially all of GPMP and its subsidiaries’ properties and assets, and pledges of the equity interests in all present and future subsidiaries (subject to certain exceptions as permitted under the Capital One Line of Credit).
Letters of Credit
Financing Facility |
|
Amount |
|
Letters of |
PNC Line of Credit |
|
$ |
|
$ |
Capital One Credit Facility |
|
$ |
|
$ |
Insurance Premium Notes
In the ordinary course of business, the Company finances insurance premiums with notes payable. These notes are generally entered into for a term of 24 months or less.
Future Scheduled Payments
Total scheduled future principal payments required and amortization of deferred financing costs under all of the foregoing debt agreements were as follows as of December 31, 2024:
|
|
Amount |
|
|
|
|
(in thousands) |
|
|
2025 |
|
$ |
|
|
2026 |
|
|
|
|
2027 |
|
|
|
|
2028 |
|
|
|
|
2029 |
|
|
|
|
Thereafter |
|
|
|
|
|
|
|
|
|
Deferred financing costs |
|
|
( |
) |
Total debt |
|
$ |
|
|
Deferred Financing Costs
Deferred financing costs of $
Financial Covenants
As part of the PNC Credit Agreement, increased reporting requirements were set in cases where the usage of the PNC Line of Credit exceeds certain thresholds, and also it is required that the undrawn availability of the PNC Line of Credit will equal to or be greater than
The M&T Credit Agreement requires GPM to maintain a leverage ratio and a debt service coverage ratio.
F-33
The Capital One Line of Credit requires GPMP to maintain certain financial covenants, including a leverage ratio and an interest coverage expense ratio.
As of December 31, 2024, the Company was in compliance with all of the obligations and financial covenants under the terms and provisions of its loans with financial institutions.
13. Commitments and Contingencies
Environmental Liabilities and Contingencies
The Company is responsible for certain environmental costs and legal expenses arising in the ordinary course of business. See Note 15 for further discussion.
Asset Retirement Obligation
As part of the fuel operations at its retail convenience stores and proprietary cardlock locations, at most of the other owned and leased locations leased to dealers, certain other dealer locations and private cardlock locations, there are aboveground and underground storage tanks for which the Company is responsible. The future cost to remove a storage tank is recognized over the estimated remaining useful life of the storage tank, or if sooner, the termination of the applicable lease. A liability for the fair value of an asset retirement obligation with a corresponding increase to the carrying value of the related long-lived asset is recorded at the time a storage tank is installed. The amount added to equipment or right-of-use asset is amortized and accretion expense is recognized in connection with the discounted liability over the remaining life of the respective storage tanks. The accretion of the asset retirement obligation is recorded in interest and other financial expenses in the consolidated statements of operations.
The estimated liability is based upon historical experience in removing storage tanks, estimated tank useful lives, external estimates as to the cost to remove the tanks in the future and current and anticipated federal and state regulatory requirements governing the removal of tanks, and discounted. The asset retirement obligations are re-evaluated annually and revisions to the liability could occur due to changes in estimates of tank removal costs or timing, tank useful lives or whether federal or state regulators enact new guidance on the removal of such tanks.
A reconciliation and roll forward of the liability for the removal of its storage tanks was as follows:
|
|
2024 |
|
|
2023 |
|
||
|
|
(in thousands) |
|
|||||
Beginning Balance as of January 1, |
|
$ |
|
|
$ |
|
||
Acquisitions |
|
|
|
|
|
|
||
Additions |
|
|
|
|
|
|
||
Accretion expense |
|
|
|
|
|
|
||
Adjustments |
|
|
( |
) |
|
|
( |
) |
Retirement of tanks |
|
|
( |
) |
|
|
( |
) |
Ending Balance as of December 31, (*) |
|
$ |
|
|
$ |
|
||
Fuel Vendor Agreements
GPMP enters into fuel supply contracts with various major fuel suppliers. These fuel supply contracts have expiration dates at various times through June 2032. In connection with certain of these fuel supply and related incentive agreements, upfront payments and other vendor assistance payments for rebranding costs and other incentives were received. If GPMP defaults under the terms of any contract, including not purchasing committed fuel purchase volume, or terminates any supply agreement prior to the end of the applicable term, GPMP must refund and reimburse the respective fuel supplier for the unearned unamortized portion of the payments received to date, based on the amortization schedule outlined in each respective agreement and refund other benefits from each supplier subject to the terms that were set in the incentive agreement, as well as pay a penalty with regard to the early termination if applicable. The payments are amortized and recognized as a reduction to fuel costs using the straight-line method based on the term of each agreement or based on fuel volume purchased. The amount of the unamortized liability was $
F-34
Purchase Commitments
In the ordinary course of business, the Company has entered into agreements with fuel suppliers to purchase inventories for varying periods of time. The fuel vendor agreements with suppliers require minimum volume purchase commitments of gasoline, which vary throughout the period of supply agreements and distillates annually. The future minimum volume purchase requirements under the existing supply agreements are based on gallons, with a purchase price at prevailing market rates for wholesale distributions. If the Company fails to purchase the required minimum volume during a contract year, the underlying supplier’s exclusive remedies (depending on the magnitude of the failure) are either termination of the supply agreement and/or an agreed monetary compensation. Based upon GPMP’s current and future expected purchases, the Company does not anticipate incurring penalties for volume shortfalls with isolated de minimis exceptions.
The total future minimum gallon volume purchase requirements from fuel vendors were as follows:
|
|
Gallons |
|
|
|
|
(in thousands) |
|
|
2025 |
|
|
|
|
2026 |
|
|
|
|
2027 |
|
|
|
|
2028 |
|
|
|
|
2029 |
|
|
|
|
Thereafter |
|
|
|
|
Total |
|
|
|
|
Merchandise Vendor Agreements
The Company enters into various merchandise product supply agreements with major merchandise vendors. The Company receives incentives for agreeing to exclusive distribution rights for the suppliers of certain products.
Potential Wage and Hour Class Action
A law firm representing store managers in multiple states sent the Company a letter, alleging that the Company violated the Fair Labor Standards Act and state laws by classifying certain store managers as exempt from overtime. The Company has entered into a tolling agreement with opposing counsel to provide the Company with sufficient time to investigate the allegations. The letter did not quantify any alleged damages but stated that the store managers may seek collective and/or class certification.
Given the uncertainty of the result of any litigation and the undetermined nature of the number of putative collective and/or class members, the subset of store managers who would fall into such putative collective and/or class, the number of putative collective members who would participate if a collective was certified, the states for which class certification would be sought and the number of employees at issue in each such alleged class, the Company cannot reasonably estimate the possible loss or range of loss, if any, that may result from this action; therefore, no accrual has been made related to this matter.
Other Legal Matters
The Company is a party to various legal actions, as both plaintiff and defendant, in the ordinary course of business. The Company’s management believes, based on estimations with support from legal counsel for these matters, that these legal actions are routine in nature and incidental to the operation of the Company’s business and that it is not reasonably probable that the ultimate resolution of these matters will have a material adverse impact on the Company’s business, financial condition, results of operations and cash flows.
14. Leases
Lessee
As of December 31, 2024,
As of December 31, 2024,
F-35
agreement, the lease agreements contain cross-default provisions between all or some of the other lease agreements with the same landlord.
The lease agreements include lease payments that are set at the beginning of the lease, but which may increase by a specified increment or pursuant to a formula both during the course of the initial period and any additional option periods. Some of the lease agreements include escalation clauses based on the consumer price index, with the majority of these lease agreements including an increase in the consumer price index coupled with a multiplier and a percentage increase cap which effectively assures the cap will be reached each year. Lease payments determined as in-substance fixed payments are included in the lease payments used for the measurement of the lease liabilities. Some of the lease agreements include lease payments which are contingent upon fuel and merchandise sales (these amounts were not material during the above periods). In some of the lease agreements, the right of first refusal to purchase the sites from the lessor is given and in some of the lease agreements an option to purchase the sites from the lessor is given.
The leases are typically triple net leases whereby the lessor is responsible for the repair and maintenance at the site, insurance and property taxes in addition to environmental compliance.
The components of lease cost recorded on the consolidated statements of operations were as follows:
|
|
For the Year Ended December 31, |
|
|||||||||
|
|
2024 |
|
|
2023 |
|
|
2022 |
|
|||
|
|
(in thousands) |
|
|||||||||
Finance lease cost: |
|
|
|
|
|
|
|
|
|
|||
Depreciation of right-of-use assets |
|
$ |
|
|
$ |
|
|
$ |
|
|||
Interest on lease liabilities |
|
|
|
|
|
|
|
|
|
|||
Operating lease costs included in site operating expenses |
|
|
|
|
|
|
|
|
|
|||
Operating lease costs included in general and administrative expenses |
|
|
|
|
|
|
|
|
|
|||
Lease cost related to variable lease payments, short-term leases |
|
|
|
|
|
|
|
|
|
|||
Right-of-use asset impairment charges and loss (gain) on disposals of leases, net |
|
|
|
|
|
|
|
|
|
|||
Total lease costs |
|
$ |
|
|
$ |
|
|
$ |
|
|||
For the years ended December 31, 2024, 2023 and 2022, total cash outflows for leases amounted to approximately $
Supplemental balance sheet data related to leases was as follows:
|
|
As of December 31, |
|
|||||
|
|
2024 |
|
|
2023 |
|
||
|
|
(in thousands) |
|
|||||
Operating leases |
|
|
|
|
|
|
||
Assets |
|
|
|
|
|
|
||
Right-of-use assets under operating leases |
|
$ |
|
|
$ |
|
||
Liabilities |
|
|
|
|
|
|
||
Operating leases, current portion |
|
|
|
|
|
|
||
Operating leases |
|
|
|
|
|
|
||
Total operating leases |
|
|
|
|
|
|
||
Weighted average remaining lease term (in years) |
|
|
|
|
|
|
||
Weighted average discount rate |
|
|
% |
|
|
% |
||
Financing leases |
|
|
|
|
|
|
||
Assets |
|
|
|
|
|
|
||
Right-of-use assets |
|
$ |
|
|
$ |
|
||
Accumulated amortization |
|
|
( |
) |
|
|
( |
) |
Right-of-use assets under financing leases, net |
|
|
|
|
|
|
||
Liabilities |
|
|
|
|
|
|
||
Financing leases, current portion |
|
|
|
|
|
|
||
Financing leases |
|
|
|
|
|
|
||
F-36
Total financing leases |
|
|
|
|
|
|
||
Weighted average remaining lease term (in years) |
|
|
|
|
|
|
||
Weighted average discount rate |
|
|
% |
|
|
% |
As of December 31, 2024, future minimum payments for operating lease obligations and financing lease obligations were as set forth in the following table.
|
|
Operating |
|
|
Financing |
|
||
|
|
(in thousands) |
|
|||||
2025 |
|
$ |
|
|
$ |
|
||
2026 |
|
|
|
|
|
|
||
2027 |
|
|
|
|
|
|
||
2028 |
|
|
|
|
|
|
||
2029 |
|
|
|
|
|
|
||
Thereafter |
|
|
|
|
|
|
||
Gross lease payments |
|
$ |
|
|
$ |
|
||
Less: imputed interest |
|
|
( |
) |
|
|
( |
) |
Total lease liabilities |
|
$ |
|
|
$ |
|
||
Lessor
The Company leases and subleases owned and leased properties to dealers and other tenants and subtenants which are accounted for as operating or sales-type leases. The majority of leases and subleases are for periods of up to
As of December 31, 2024, future minimum payments to be received under these operating leases were as follows:
|
|
Amount |
|
|
|
|
(in thousands) |
|
|
2025 |
|
$ |
|
|
2026 |
|
|
|
|
2027 |
|
|
|
|
2028 |
|
|
|
|
2029 |
|
|
|
|
Thereafter |
|
|
|
|
|
|
$ |
|
|
15. Environmental Liabilities
The Company is subject to certain federal and state environmental laws and regulations associated with sites at which it stores and sells fuel and other fuel products, as well as at owned and leased locations leased or subleased to dealers.
Costs incurred to comply with federal and state environmental regulations are accounted for as follows:
F-37
As of December 31, 2024 and 2023, totaled $
The Company maintains certain environmental insurance policies and participates in various state underground storage tank funds that entitle it to be reimbursed for remediation costs. Estimated amounts that will be recovered from its insurance policies and various state funds for the exposures totaled $
The undiscounted amounts of future estimated payments and anticipated recoveries from insurance policies and various state funds as of December 31, 2024 were as follows:
|
|
Payments |
|
|
Recoveries |
|
|
Net |
|
|||
|
|
(in thousands) |
|
|||||||||
2025 |
|
$ |
|
|
$ |
|
|
$ |
|
|||
2026 |
|
|
|
|
|
|
|
|
|
|||
2027 |
|
|
|
|
|
|
|
|
|
|||
2028 |
|
|
|
|
|
|
|
|
|
|||
2029 |
|
|
|
|
|
|
|
|
|
|||
Thereafter |
|
|
|
|
|
|
|
|
|
|||
Total Future Payments and Recoveries |
|
$ |
|
|
$ |
|
|
$ |
|
|||
16. Income Taxes
The Company and its subsidiaries file federal, state, local and foreign income tax returns in jurisdictions with varying statutes of limitation. The Company and its subsidiaries are classified as a Corporation and file on a consolidated, unitary or combined basis for U.S. federal and most state jurisdictions for income tax purposes. The Company’s indirectly wholly owned subsidiary, GPM, had been classified through July 31, 2022 as a partnership for U.S. federal and state jurisdictions for income tax purposes, and effective July 31, 2022, has been classified as a disregarded entity for U.S. federal tax purposes.
In the first quarter of 2024, the Riiser Seller satisfied certain post-closing adjustment amounts owed to GPM by tendering all of its limited partnership units in GPMP. Effective January 26, 2024, the Company, indirectly, became
The Company has income tax net operating losses (“NOL”) and tax credit carryforwards related to both domestic and international operations. As of December 31, 2024, the Company has recorded a deferred tax asset of $
|
|
Amount |
|
|
Expiration Date |
F-38
|
|
(in thousands) |
|
|
|
|
Domestic state NOL |
|
$ |
|
|
||
Foreign NOL |
|
|
|
|
||
Foreign capital loss |
|
|
|
|
||
Foreign tax credits |
|
|
|
|
- |
|
At each balance sheet date, the Company’s management assesses available positive and negative evidence to estimate if sufficient future taxable income will be generated to use the existing deferred tax assets. This assessment is performed tax jurisdiction by tax jurisdiction. Based on this assessment, a valuation allowance has been recorded to reflect the portion of the deferred tax asset that is more likely than not to be realized.
The Company recorded a valuation allowance related to U.S. jurisdictions in the amount of $
The benefits of tax positions are not recorded unless it is more likely than not the tax position would be sustained upon challenge by the appropriate tax authorities. As of both December 31, 2024 and 2023, the Company and its subsidiaries have recorded $
|
|
2024 |
|
|
2023 |
|
||
|
|
(in thousands) |
|
|||||
Beginning balance as of January 1, |
|
$ |
|
|
$ |
|
||
Additions for tax positions taken in prior years |
|
|
|
|
|
|
||
Reductions of tax positions taken in prior years |
|
|
|
|
|
|
||
Reductions for settlements on tax positions of prior years |
|
|
|
|
|
|
||
Ending balance as of December 31, |
|
$ |
|
|
$ |
|
||
Each of the Company’s subsidiaries is subject to examination in their respective filing jurisdiction. For the Company’s U.S. subsidiaries, tax years ending after December 31, 2020 remain open. The Company’s foreign subsidiaries’ tax returns up to and including tax year 2019 are considered closed due to the statute of limitations.
Earnings before income taxes were as follows:
|
|
For the Year Ended December 31, |
|
|||||||||
|
|
2024 |
|
|
2023 |
|
|
2022 |
|
|||
|
|
(in thousands) |
|
|||||||||
Domestic (U.S.) |
|
$ |
|
|
$ |
|
|
$ |
|
|||
Foreign (Israel) |
|
|
( |
) |
|
|
|
|
|
|
||
Total |
|
$ |
|
|
$ |
|
|
$ |
|
|||
The components of the income tax provision were as follows:
|
|
For the Year Ended December 31, |
|
|||||||||
|
|
2024 |
|
|
2023 |
|
|
2022 |
|
|||
|
|
(in thousands) |
|
|||||||||
Current: |
|
|
|
|
|
|
|
|
|
|||
Domestic federal |
|
$ |
|
|
$ |
|
|
$ |
|
|||
Domestic state and local |
|
|
|
|
|
|
|
|
|
|||
Total current |
|
|
|
|
|
|
|
|
|
|||
Deferred: |
|
|
|
|
|
|
|
|
|
|||
Domestic federal |
|
|
( |
) |
|
|
( |
) |
|
|
|
|
Domestic state and local |
|
|
( |
) |
|
|
( |
) |
|
|
|
|
Total deferred |
|
|
( |
) |
|
|
( |
) |
|
|
|
|
Total income tax expense |
|
$ |
|
|
$ |
|
|
$ |
|
|||
F-39
The reconciliation of significant differences between income tax expense applying the US statutory rate and the actual income tax expense at the effective rate were as follows:
|
|
For the Year Ended December 31, |
|
|||||||||||||||||||||
|
|
2024 |
|
|
2023 |
|
|
2022 |
|
|||||||||||||||
|
|
(in thousands) |
|
|||||||||||||||||||||
Income tax expense at the statutory rate |
|
$ |
|
|
|
% |
|
$ |
|
|
|
% |
|
$ |
|
|
|
% |
||||||
Increases (decreases): |
|
|
|
|
|
|
|
|
|
|
|
|
|
|
|
|
|
|
||||||
Internal entity realignment, change in entity |
|
|
|
|
|
% |
|
|
|
|
|
% |
|
|
|
|
|
% |
||||||
Non-controlling interest in partnership |
|
|
|
|
|
% |
|
|
( |
) |
|
|
( |
)% |
|
|
( |
) |
|
|
( |
)% |
||
State income taxes, net of federal income tax |
|
|
|
|
|
% |
|
|
|
|
|
% |
|
|
|
|
|
% |
||||||
International rate differential |
|
|
|
|
|
% |
|
|
|
|
|
% |
|
|
|
|
|
% |
||||||
Non-deductible expenses (non-includable |
|
|
( |
) |
|
|
( |
)% |
|
|
( |
) |
|
|
( |
)% |
|
|
|
|
|
% |
||
Valuation allowance |
|
|
( |
) |
|
|
( |
)% |
|
|
( |
) |
|
|
( |
)% |
|
|
( |
) |
|
|
( |
)% |
Credits |
|
|
( |
) |
|
|
( |
)% |
|
|
( |
) |
|
|
( |
)% |
|
|
( |
) |
|
|
( |
)% |
Expired attributes |
|
|
|
|
|
% |
|
|
|
|
|
% |
|
|
|
|
|
% |
||||||
Other rate differentials |
|
|
( |
) |
|
|
( |
)% |
|
|
|
|
|
% |
|
|
( |
) |
|
|
( |
)% |
||
Total |
|
$ |
|
|
|
% |
|
$ |
|
|
|
% |
|
$ |
|
|
|
% |
||||||
(*) refer to details above.
Significant components of deferred income tax assets and liabilities consisted of the following:
|
|
As of December 31, |
|
|||||
|
|
2024 |
|
|
2023 |
|
||
|
|
(in thousands) |
|
|||||
Deferred tax assets: |
|
|
|
|
|
|
||
Asset retirement obligation |
|
$ |
|
|
$ |
|
||
Inventory |
|
|
|
|
|
|
||
Lease obligations |
|
|
|
|
|
|
||
Financial liabilities |
|
|
|
|
|
|
||
Accrued expenses |
|
|
|
|
|
|
||
Deferred income |
|
|
|
|
|
|
||
Fuel supply agreements |
|
|
|
|
|
|
||
Environmental liabilities |
|
|
|
|
|
|
||
Transaction costs |
|
|
|
|
|
|
||
Investment in partnership |
|
|
|
|
|
|
||
Share-based compensation |
|
|
|
|
|
|
||
Net operating loss carryforwards |
|
|
|
|
|
|
||
Credits |
|
|
|
|
|
|
||
Interest limitation carryforward |
|
|
|
|
|
|
||
Other |
|
|
|
|
|
|
||
Total deferred tax assets |
|
|
|
|
|
|
||
Valuation allowance |
|
|
( |
) |
|
|
( |
) |
Total deferred tax assets, net |
|
|
|
|
|
|
||
Deferred tax liabilities: |
|
|
|
|
|
|
||
Property and equipment |
|
|
( |
) |
|
|
( |
) |
Intangible assets |
|
|
( |
) |
|
|
( |
) |
Right-of-use assets |
|
|
( |
) |
|
|
( |
) |
Prepaid expenses |
|
|
( |
) |
|
|
( |
) |
Other |
|
|
( |
) |
|
|
( |
) |
Total deferred tax liabilities |
|
|
( |
) |
|
|
( |
) |
Net deferred tax asset |
|
$ |
|
|
$ |
|
||
F-40
17. Equity and Temporary Equity
Dividends
The Company’s board of directors (the “Board”) declared, and the Company paid, dividends of $
Share Repurchase Plan
In February 2022, the Board authorized a share repurchase program, which was subsequently increased in May 2023 and May 2024, to provide for the repurchase up to an aggregate of $
Series A Redeemable Preferred Stock
On November 18, 2020, the Company entered into a subscription agreement with certain investors (the “Subscription Agreement”) for the purchase by such investors of
The key terms of the Series A Stock are as follows:
F-41
In addition, if the Company undergoes a change of control (as defined in the Charter), each holder, at such holder’s election, may require the Company to purchase all or a portion of such holder’s shares of Series A Stock that have not been converted, at a purchase price per share of Series A Stock, payable in cash, equal to the greater of (A) the sum of (x) the product of
F-42
Classification of Convertible Preferred Stock – The Series A Stock is considered contingently redeemable based on events that are not solely within the Company’s control. Accordingly, the Series A Stock is presented outside of permanent equity in the temporary equity section of the consolidated balance sheets. As of December 31, 2024 and 2023, the Series A Stock was accreted to its full redemption value.
Deferred Shares
Ares Warrants
On December 22, 2020, certain entities affiliated with Ares Capital Corporation (“Ares”) exchanged their warrants to acquire membership interests in GPM for warrants (the “Ares Warrants”) to purchase
The Ares Warrants Price and the number of Ares Warrant Shares for which each Ares Warrant remains exercisable will each be proportionally adjusted on an equitable basis in the event of a stock split, reverse stock split or similar recapitalization event.
An Ares Warrant and all rights thereunder may not be transferred by the holder thereof, in whole or in part, without the written consent of the Company, which written consent may be withheld or given in the Company’s sole discretion; provided, however, no such written consent of the Company shall be required with respect to a transfer of such warrant by such holder to an affiliate thereof.
18. Share-Based Compensation
The Compensation Committee of the Board has approved the grant of non-qualified stock options, restricted stock units (“RSUs”), and shares of common stock to certain employees, non-employees and members of the Board under the ARKO Corp. 2020 Incentive Compensation Plan (as amended, the “Plan”). At the Company’s 2024 annual meeting of stockholders held on June 6, 2024, the Company’s stockholders approved an increase in the total number of shares of common stock authorized for issuance under the Plan from
Additionally, a non-employee director may receive RSUs in lieu of up to
Stock Options
The following table summarizes share activity related to stock options:
|
|
Stock Options |
|
|
Weighted Average Exercise Price |
|
|
Weighted Average Fair Value |
|
|
Remaining Average Contractual Term (Years) |
|
|
Aggregate Intrinsic Value |
|
|||||
|
|
(in thousands) |
|
|
|
|
|
|
|
|
|
|
|
(in thousands) |
|
|||||
Options Outstanding, January 1, 2023 |
|
|
|
|
$ |
|
|
|
|
|
|
|
|
|
|
|||||
Granted |
|
|
|
|
|
|
|
|
|
|
|
|
|
|
|
|||||
Options Outstanding, December 31, 2023 |
|
|
|
|
$ |
|
|
|
|
|
|
|
|
$ |
|
|||||
Granted |
|
|
|
|
|
|
|
|
|
|
|
|
|
|
|
|||||
Options Outstanding, December 31, 2024 |
|
|
|
|
$ |
|
|
|
|
|
|
|
|
$ |
|
|||||
|
|
|
|
|
|
|
|
|
|
|
|
|
|
|
|
|||||
Exercisable at December 31, 2024 |
|
|
|
|
$ |
|
|
|
|
|
|
|
|
$ |
|
|||||
Vested and expected to vest at December 31, 2024 |
|
|
|
|
$ |
|
|
|
|
|
|
|
|
$ |
|
|||||
F-43
The aggregate intrinsic value is the difference between the exercise price and the closing price of the Company’s common stock on December 31.
In the years ended December 31, 2024 and 2023,
As of December 31, 2024, total unrecognized compensation cost related to unvested stock options was approximately $
The fair value of each stock option award is estimated by management on the date of the grant using the Black-Scholes option pricing model.
|
|
For the Year Ended December 31, 2023 |
|
|
Expected dividend rate |
|
|
% |
|
Expected stock price volatility |
|
|
% |
|
Risk-free interest rate |
|
|
% |
|
Expected term of options (years) |
|
|
|
|
The expected stock price volatility is based on the historical volatility of the Company’s stock price plus the Company’s peer group’s stock price for the period prior to the Company’s listing on Nasdaq. The volatilities are estimated for a period of time equal to the expected term of the related option. The risk-free interest rate is based on the implied yield of U.S. Treasury zero-coupon issues with an equivalent remaining term. The expected term of the options represents the estimated period of time until exercise and is determined by considering the contractual terms, vesting schedule and expectations of future employee behavior.
Restricted Stock Units and Performance-based Restricted Stock Units
The following table summarizes share activity related to RSUs and performance-based RSUs (“PSUs”):
|
|
RSUs and PSUs |
|
|
Weighted Average Grant Date Fair Value |
|
||
|
|
(in thousands) |
|
|
|
|
||
Nonvested RSUs and PSUs, January 1, 2023 |
|
|
|
|
$ |
|
||
Granted |
|
|
|
|
|
|
||
Released |
|
|
( |
) |
|
|
|
|
Forfeited |
|
|
( |
) |
|
|
|
|
Performance-based share adjustment |
|
|
( |
) |
|
|
|
|
Nonvested RSUs and PSUs, December 31, 2023 |
|
|
|
|
$ |
|
||
Granted |
|
|
|
|
|
|
||
Released |
|
|
( |
) |
|
|
|
|
Forfeited |
|
|
( |
) |
|
|
|
|
Performance-based share adjustment |
|
|
( |
) |
|
|
|
|
Nonvested RSUs and PSUs, December 31, 2024 |
|
|
|
|
$ |
|
||
In the years ended December 31, 2024 and 2023,
The fair value of RSUs and PSUs released during the years ended December 31, 2024, 2023 and 2022 was $
In the years ended December 31, 2024, 2023 and 2022, the Company granted approximately
The Company assesses the probability of achieving the performance criteria on a quarterly basis. In the first quarter of 2024, the Compensation Committee of the Board determined that the performance criteria for the performance period ended December 31, 2023 had been met and certified that the percentage of PSUs that vested with respect to the target amount for the 2021 PSU grants was
F-44
As of December 31, 2024, total unrecognized compensation cost related to RSUs and PSUs was approximately $
Share-Based Compensation Cost
Total share-based compensation cost recorded for employees, non-employees and members of the Board for the years ended December 31, 2024, 2023 and 2022 was $
19. Related Party Transactions
Balances outstanding with related parties were as follows:
|
|
As of December 31, |
|
|||||
|
|
2024 |
|
|
2023 |
|
||
|
|
(in thousands) |
|
|||||
Current assets: |
|
|
|
|
|
|
||
Due from equity investment |
|
$ |
|
|
$ |
|
||
Loan to equity investment |
|
|
|
|
|
|
||
Due from related parties |
|
|
|
|
|
|
||
20. Earnings per Share
The following table sets forth the computation of basic and diluted net income per share of common stock:
|
|
For the Year Ended December 31, |
|
|||||||||
|
|
2024 |
|
|
2023 |
|
|
2022 |
|
|||
|
|
(in thousands) |
|
|||||||||
Net income available to common stockholders |
|
$ |
|
|
$ |
|
|
$ |
|
|||
Change in fair value of Ares Put Option (see Note 22) |
|
|
|
|
|
|
|
|
( |
) |
||
Net income available to common stockholders after assumed conversions |
|
$ |
|
|
$ |
|
|
$ |
|
|||
|
|
|
|
|
|
|
|
|
|
|||
Weighted average common shares outstanding — Basic |
|
|
|
|
|
|
|
|
|
|||
Effect of dilutive securities: |
|
|
|
|
|
|
|
|
|
|||
RSUs |
|
|
|
|
|
|
|
|
|
|||
Ares Put Option (see Note 22) |
|
|
|
|
|
|
|
|
|
|||
Weighted average common shares outstanding — Diluted |
|
|
|
|
|
|
|
|
|
|||
Net income per share available to common stockholders — Basic |
|
$ |
|
|
$ |
|
|
$ |
|
|||
Net income per share available to common stockholders — Diluted |
|
$ |
|
|
$ |
|
|
$ |
|
|||
The following potential shares of common stock have been excluded from the computation of diluted net income per share because their effect would have been antidilutive:
|
|
As of December 31, |
|
|||||||||
|
|
2024 |
|
|
2023 |
|
|
2022 |
|
|||
|
|
(in thousands) |
|
|||||||||
Ares Warrants |
|
|
|
|
|
|
|
|
|
|||
Public and Private Warrants |
|
|
|
|
|
|
|
|
|
|||
Series A redeemable preferred stock |
|
|
|
|
|
|
|
|
|
|||
Stock options |
|
|
|
|
|
|
|
|
|
|||
21. Financial Derivative Instruments
F-45
The Company makes limited use of derivative instruments (futures contracts) to manage certain risks related to diesel fuel prices. The Company does not hold any derivatives for speculative purposes and it does not use derivatives with leveraged or complex features. The Company currently uses derivative instruments that are traded primarily over national exchanges such as the New York Mercantile Exchange (“NYMEX”). For accounting purposes, the Company has designated its derivative contracts as fair value hedges of firm commitments.
As of December 31, 2024 and 2023, the Company had fuel futures contracts to hedge approximately
As of December 31, 2024 and 2023, there was $
22. Fair Value Measurements and Financial Instruments
The Company utilizes fair value measurement guidance prescribed by accounting standards to value its financial instruments. The guidance specifies a three-level hierarchy that is used when measuring and disclosing fair value. The fair value hierarchy gives the highest priority to quoted prices available in active markets (i.e. observable inputs) and the lowest priority to data lacking transparency (i.e. unobservable inputs). An instrument’s categorization within the fair value hierarchy is based on the lowest level of significant input to its valuation. The following is a description of the three hierarchy levels.
Level 1: Inputs to the valuation methodology are unadjusted quoted prices for identical assets or liabilities in active markets.
Level 2: Inputs to the valuation methodology include quoted market prices for similar assets and liabilities in active markets, quoted prices for identical or similar assets or liabilities in inactive markets, and inputs that are observable for the asset or liability, either directly or indirectly, for substantially the full term of the financial instrument.
Level 3: Inputs to the valuation methodology are unobservable and significant to the fair value adjustment.
The fair value of cash and cash equivalents, restricted cash, short-term investments, trade receivables, accounts payable and other current liabilities approximated their carrying values as of December 31, 2024 and 2023 primarily due to the short-term maturity of these instruments. Based on market trades of the Senior Notes close to year-end (Level 1 fair value measurement), the fair value of the Senior Notes was estimated at approximately $
The Contingent Consideration from the Empire acquisition in 2020 is measured at fair value at the end of each reporting period and amounted to $
The Public Warrants (as defined in Note 10), of which approximately
The Private Warrants (as defined in Note 10), of which approximately
F-46
valuation methodology are unobservable and significant to the fair value adjustment.
|
|
As of December 31, |
|
|||||
|
|
2024 |
|
|
2023 |
|
||
|
|
|
|
|
|
|
||
Expected term (in years) |
|
|
|
|
|
|
||
Volatility |
|
|
% |
|
|
% |
||
Risk-free interest rate |
|
|
% |
|
|
% |
||
Expected dividend yield |
|
|
% |
|
|
% |
||
Strike price |
|
$ |
|
|
$ |
|
||
For the change in the fair value of the Private Warrants, approximately $
The Additional Deferred Shares (as defined in Note 17) are measured at fair value at the end of each reporting period and amounted to $
|
|
As of December 31, |
|
|||||
|
|
2024 |
|
|
2023 |
|
||
|
|
|
|
|
|
|
||
Expected term (in years) |
|
|
|
|
|
|
||
Volatility |
|
|
% |
|
|
% |
||
Risk-free interest rate |
|
|
% |
|
|
% |
||
Stock price |
|
$ |
|
|
$ |
|
||
For the change in the fair value of the Additional Deferred Shares, approximately $
Ares Put Option
On September 8, 2020, the Company entered into an agreement with Ares and certain of its affiliates (the “Ares Put Option”), which guaranteed Ares a value of approximately $
On April 3, 2023, the Company and Ares agreed that in lieu of the Company issuing to Ares additional shares of common stock in accordance with the Ares Put Option or purchasing the Ares Shares, Ares would retain the Ares Shares, and the Company would pay approximately $
23. Segment Reporting
The reportable segments were determined based on information reviewed by the Company’s chief operating decision maker (“CODM”) for operational decision-making purposes, and the segment information is prepared on the same basis that the CODM
F-47
reviews such financial information. The Company’s reportable segments are retail, wholesale, fleet fueling and GPMP. The CODM utilizes operating income from each segment to assess its operating performance and to make decisions about allocating resources to each segment. Arie Kotler, the Company’s is the CODM.
The accounting policies of the segments are the same as those described in the summary of significant accounting policies except that rent expenses for each segment are recognized and measured on the basis of cash payments.
The retail segment includes the operation of a chain of retail stores, which includes convenience stores selling fuel products and other merchandise to retail customers. At its retail convenience stores, the Company owns the merchandise and fuel inventory and employs personnel to manage the store.
The wholesale segment supplies fuel to dealers, sub-wholesalers and bulk and spot purchasers, on either a cost plus or consignment basis. For consignment arrangements, the Company retains ownership of the fuel inventory at the site, is responsible for the pricing of the fuel to the end consumer, and shares the gross profit with the dealers.
The fleet fueling segment includes the operation of proprietary and third-party cardlock locations (unstaffed fueling locations), and commissions from the sales of fuel using proprietary fuel cards that provide customers access to a nationwide network of fueling sites.
The GPMP segment includes GPMP and includes its sale and supply of fuel to substantially all of GPM’s sites that sell fuel in the retail and wholesale segments, at GPMP’s cost of fuel (including taxes and transportation) plus a fixed margin (currently
The “All Other” segment includes the results of non-reportable segments which do not meet both quantitative and qualitative criteria as defined under ASC 280, Segment Reporting.
The significant expense categories and amounts align with the segment-level information that is regularly provided to the CODM. Intersegment expenses are included within the amounts shown, however, the fuel costs in the retail, wholesale and fleet segments exclude the estimated fixed margin or fixed fee paid to GPMP for the cost of fuel.
The majority of general and administrative expenses, depreciation and amortization, net other expenses, net interest and other financial expenses, income taxes and minor other income items including intercompany operating leases are not allocated to the segments. Other segment expenses include utilities, telephone, upkeep and taxes, insurance, supplies, advertising, and certain other expenses. Other segment expenses in the GPMP segment also include general and administrative expenses, depreciation and amortization, and other income, net.
With the exception of goodwill as described in Note 9 above, assets and liabilities relevant to the reportable segments are generally not assigned to any particular segment, but rather, managed and reviewed by the CODM at the consolidated level. All reportable segment revenues were generated from sites within the U.S. and substantially all of the Company’s assets were within the U.S. No external customer represented more than 10% of revenues.
Inter-segment transactions primarily included the distribution of fuel by GPMP to substantially all of GPM’s sites that sell fuel (both in the retail and wholesale segments) and charges by GPMP primarily to sites that sell fuel in the fleet fueling segment which are not supplied by GPMP. The effect of these inter-segment transactions was eliminated in the consolidated financial statements.
F-48
Year Ended December 31, 2024 |
|
Retail |
|
|
Wholesale |
|
|
Fleet Fueling |
|
|
GPMP |
|
|
All Other |
|
|
Total |
|
||||||
|
|
(in thousands) |
|
|||||||||||||||||||||
Revenues |
|
|
|
|
|
|
|
|
|
|
|
|
|
|
|
|
|
|
||||||
Fuel revenue |
|
$ |
|
|
$ |
|
|
$ |
|
|
$ |
|
|
$ |
|
|
$ |
|
||||||
Merchandise revenue |
|
|
|
|
|
|
|
|
|
|
|
|
|
|
|
|
|
|
||||||
Other revenues, net |
|
|
|
|
|
|
|
|
|
|
|
|
|
|
|
|
|
|
||||||
Total revenues from external customers |
|
$ |
|
|
$ |
|
|
$ |
|
|
$ |
|
|
$ |
|
|
$ |
|
||||||
Inter-segment revenues |
|
$ |
|
|
$ |
|
|
$ |
|
|
$ |
|
|
$ |
|
|
$ |
|
||||||
|
|
|
|
|
|
|
|
|
|
|
|
|
|
|
|
|
|
|
||||||
Fuel costs |
|
$ |
|
|
$ |
|
|
$ |
|
|
$ |
|
|
|
|
|
|
|
||||||
Merchandise costs |
|
|
|
|
|
|
|
|
|
|
|
|
|
|
|
|
|
|
||||||
Salaries and wages |
|
|
|
|
|
|
|
|
|
|
|
|
|
|
|
|
|
|
||||||
Credit card fees |
|
|
|
|
|
|
|
|
|
|
|
|
|
|
|
|
|
|
||||||
Rent |
|
|
|
|
|
|
|
|
|
|
|
|
|
|
|
|
|
|
||||||
Repairs and maintenance |
|
|
|
|
|
|
|
|
|
|
|
|
|
|
|
|
|
|
||||||
Other segment expenses |
|
|
|
|
|
|
|
|
|
|
|
|
|
|
|
|
|
|
||||||
Operating income (loss) from segments |
|
$ |
|
|
$ |
|
|
$ |
|
|
$ |
|
|
$ |
( |
) |
|
$ |
|
|||||
Interest and other financial expenses, net |
|
|
|
|
|
|
|
|
|
|
$ |
( |
) |
|
|
|
|
$ |
( |
) |
||||
Income from equity investment |
|
|
|
|
|
|
|
|
|
|
|
|
|
$ |
|
|
$ |
|
||||||
Year Ended December 31, 2023 |
|
Retail |
|
|
Wholesale |
|
|
Fleet Fueling |
|
|
GPMP |
|
|
All Other |
|
|
Total |
|
||||||
|
|
(in thousands) |
|
|||||||||||||||||||||
Revenues |
|
|
|
|
|
|
|
|
|
|
|
|
|
|
|
|
|
|
||||||
Fuel revenue |
|
$ |
|
|
$ |
|
|
$ |
|
|
$ |
|
|
$ |
|
|
$ |
|
||||||
Merchandise revenue |
|
|
|
|
|
|
|
|
|
|
|
|
|
|
|
|
|
|
||||||
Other revenues, net |
|
|
|
|
|
|
|
|
|
|
|
|
|
|
|
|
|
|
||||||
Total revenues from external customers |
|
|
|
|
|
|
|
|
|
|
|
|
|
|
|
|
|
|
||||||
Inter-segment revenues |
|
$ |
|
|
$ |
|
|
$ |
|
|
$ |
|
|
$ |
|
|
$ |
|
||||||
|
|
|
|
|
|
|
|
|
|
|
|
|
|
|
|
|
|
|
||||||
Fuel costs |
|
$ |
|
|
$ |
|
|
$ |
|
|
$ |
|
|
|
|
|
|
|
||||||
Merchandise costs |
|
|
|
|
|
|
|
|
|
|
|
|
|
|
|
|
|
|
||||||
Salaries and wages |
|
|
|
|
|
|
|
|
|
|
|
|
|
|
|
|
|
|
||||||
Credit card fees |
|
|
|
|
|
|
|
|
|
|
|
|
|
|
|
|
|
|
||||||
Rent |
|
|
|
|
|
|
|
|
|
|
|
|
|
|
|
|
|
|
||||||
Repairs and maintenance |
|
|
|
|
|
|
|
|
|
|
|
|
|
|
|
|
|
|
||||||
Other segment expenses |
|
|
|
|
|
|
|
|
|
|
|
|
|
|
|
|
|
|
||||||
Operating income from segments |
|
$ |
|
|
$ |
|
|
$ |
|
|
$ |
|
|
$ |
|
|
$ |
|
||||||
Interest and other financial expenses, net |
|
|
|
|
|
|
|
|
|
|
$ |
( |
) |
|
|
|
|
$ |
( |
) |
||||
Loss from equity investment |
|
|
|
|
|
|
|
|
|
|
|
|
|
$ |
( |
) |
|
$ |
( |
) |
||||
F-49
Year Ended December 31, 2022 |
|
Retail |
|
|
Wholesale |
|
|
Fleet Fueling |
|
|
GPMP |
|
|
All Other |
|
|
Total |
|
||||||
|
|
(in thousands) |
|
|||||||||||||||||||||
Revenues |
|
|
|
|
|
|
|
|
|
|
|
|
|
|
|
|
|
|
||||||
Fuel revenue |
|
$ |
|
|
$ |
|
|
$ |
|
|
$ |
|
|
$ |
|
|
$ |
|
||||||
Merchandise revenue |
|
|
|
|
|
|
|
|
|
|
|
|
|
|
|
|
|
|
||||||
Other revenues, net |
|
|
|
|
|
|
|
|
|
|
|
|
|
|
|
|
|
|
||||||
Total revenues from external customers |
|
$ |
|
|
$ |
|
|
$ |
|
|
$ |
|
|
$ |
|
|
$ |
|
||||||
Inter-segment revenues |
|
$ |
|
|
$ |
|
|
$ |
|
|
$ |
|
|
$ |
|
|
$ |
|
||||||
|
|
|
|
|
|
|
|
|
|
|
|
|
|
|
|
|
|
|
||||||
Fuel costs |
|
$ |
|
|
$ |
|
|
$ |
|
|
$ |
|
|
|
|
|
|
|
||||||
Merchandise costs |
|
|
|
|
|
|
|
|
|
|
|
|
|
|
|
|
|
|
||||||
Salaries and wages |
|
|
|
|
|
|
|
|
|
|
|
|
|
|
|
|
|
|
||||||
Credit card fees |
|
|
|
|
|
|
|
|
|
|
|
|
|
|
|
|
|
|
||||||
Rent |
|
|
|
|
|
|
|
|
|
|
|
|
|
|
|
|
|
|
||||||
Repairs and maintenance |
|
|
|
|
|
|
|
|
|
|
|
|
|
|
|
|
|
|
||||||
Other segment expenses |
|
|
|
|
|
|
|
|
|
|
|
|
|
|
|
|
|
|
||||||
Operating income from segments |
|
$ |
|
|
$ |
|
|
$ |
|
|
$ |
|
|
$ |
|
|
$ |
|
||||||
Interest and other financial expenses, net |
|
|
|
|
|
|
|
|
|
|
$ |
( |
) |
|
|
|
|
$ |
( |
) |
||||
Loss from equity investment |
|
|
|
|
|
|
|
|
|
|
|
|
|
$ |
( |
) |
|
$ |
( |
) |
||||
A reconciliation of operating income from reportable segments to consolidated income before income taxes on the consolidated statements of operations was as follows:
|
|
For the Year Ended December 31, |
|
|||||||||
|
|
2024 |
|
|
2023 |
|
|
2022 |
|
|||
|
|
(in thousands) |
|
|||||||||
Operating income from reportable segments |
|
$ |
|
|
$ |
|
|
$ |
|
|||
All other operating loss (income) |
|
|
( |
) |
|
|
|
|
|
|
||
Intercompany charges by GPMP 1 |
|
|
( |
) |
|
|
( |
) |
|
|
( |
) |
Interest and other financial expenses, net |
|
|
( |
) |
|
|
( |
) |
|
|
( |
) |
Amounts not allocated to segments: |
|
|
|
|
|
|
|
|
|
|||
Site operating expenses |
|
|
( |
) |
|
|
( |
) |
|
|
|
|
General and administrative expenses |
|
|
( |
) |
|
|
( |
) |
|
|
( |
) |
Depreciation and amortization |
|
|
( |
) |
|
|
( |
) |
|
|
( |
) |
Other expenses, net |
|
|
( |
) |
|
|
( |
) |
|
|
( |
) |
Interest and other financial expenses, net |
|
|
( |
) |
|
|
( |
) |
|
|
( |
) |
Income before income taxes |
|
$ |
|
|
$ |
|
|
$ |
|
|||
1 Represents the estimated fixed margin or fixed fee (currently
F-50
SCHEDULE I
ARKO Corp. (Parent Company Only)
Condensed Balance Sheets
(in thousands)
|
|
As of December 31, |
|
|||||
|
|
2024 |
|
|
2023 |
|
||
Assets |
|
|
|
|
|
|
||
Current assets: |
|
|
|
|
|
|
||
Cash and cash equivalents |
|
$ |
|
|
$ |
|
||
Other current assets |
|
|
|
|
|
|
||
Total current assets |
|
|
|
|
|
|
||
Non-current assets: |
|
|
|
|
|
|
||
Investment in subsidiaries |
|
|
|
|
|
|
||
Loans to subsidiaries |
|
|
|
|
|
|
||
Deferred tax asset |
|
|
|
|
|
|
||
Total assets |
|
$ |
|
|
$ |
|
||
Liabilities |
|
|
|
|
|
|
||
Current liabilities: |
|
|
|
|
|
|
||
Long-term debt, current portion |
|
$ |
|
|
$ |
|
||
Other current liabilities |
|
|
|
|
|
|
||
Total current liabilities |
|
|
|
|
|
|
||
Non-current liabilities: |
|
|
|
|
|
|
||
Long-term debt, net |
|
|
|
|
|
|
||
Loans from investees |
|
|
|
|
|
|
||
Other non-current liabilities |
|
|
|
|
|
|
||
Total liabilities |
|
$ |
|
|
$ |
|
||
|
|
|
|
|
|
|
||
Series A redeemable preferred stock |
|
|
|
|
|
|
||
|
|
|
|
|
|
|
||
Shareholders' equity |
|
|
|
|
|
|
||
Total liabilities, redeemable preferred stock and shareholders' equity |
|
$ |
|
|
$ |
|
||
The accompanying notes are an integral part of the condensed financial statements.
F-51
SCHEDULE I
ARKO Corp. (Parent Company Only)
Condensed Statements of Operations
(in thousands)
|
|
For the Year Ended December 31, |
|
|||||||||
|
|
2024 |
|
|
2023 |
|
|
2022 |
|
|||
Income: |
|
|
|
|
|
|
|
|
|
|||
Income from loans to subsidiaries and other investee, net |
|
$ |
|
|
$ |
|
|
$ |
|
|||
|
|
|
|
|
|
|
|
|
|
|||
Expenses: |
|
|
|
|
|
|
|
|
|
|||
General and administrative |
|
|
|
|
|
|
|
|
|
|||
Other expenses |
|
|
|
|
|
|
|
|
|
|||
Income before interest and financial income (expenses) |
|
|
|
|
|
|
|
|
|
|||
Interest and other financial income |
|
|
|
|
|
|
|
|
|
|||
Interest and other financial expenses |
|
|
( |
) |
|
|
( |
) |
|
|
( |
) |
Income (loss) before income taxes |
|
|
|
|
|
|
|
|
( |
) |
||
Income tax benefit (expense) |
|
|
|
|
|
( |
) |
|
|
|
||
Equity income from subsidiaries |
|
|
|
|
|
|
|
|
|
|||
Net income |
|
$ |
|
|
$ |
|
|
$ |
|
|||
Series A redeemable preferred stock dividends |
|
|
( |
) |
|
|
( |
) |
|
|
( |
) |
Net income attributable to common shareholders |
|
$ |
|
|
$ |
|
|
$ |
|
|||
The accompanying notes are an integral part of the condensed financial statements.
F-52
SCHEDULE I
ARKO Corp. (Parent Company Only)
Condensed Statements of Cash Flows
(in thousands)
|
|
For the Year Ended December 31, |
|
|||||||||
|
|
2024 |
|
|
2023 |
|
|
2022 |
|
|||
Cash flows from operating activities: |
|
|
|
|
|
|
|
|
|
|||
Net income |
|
$ |
|
|
$ |
|
|
$ |
|
|||
Adjustments to reconcile net income to net cash provided by (used in) |
|
|
|
|
|
|
|
|
|
|||
Equity income from subsidiaries |
|
|
( |
) |
|
|
( |
) |
|
|
( |
) |
Deferred income taxes |
|
|
( |
) |
|
|
|
|
|
( |
) |
|
Amortization of deferred financing costs and debt discount |
|
|
|
|
|
|
|
|
|
|||
Foreign currency loss and interest related to intercompany balances |
|
|
|
|
|
|
|
|
|
|||
Gain from issuance of shares as payment of deferred consideration |
|
|
( |
) |
|
|
|
|
|
|
||
Share-based compensation |
|
|
|
|
|
|
|
|
|
|||
Fair value adjustment of financial liabilities |
|
|
( |
) |
|
|
( |
) |
|
|
( |
) |
Other operating activities, net |
|
|
|
|
|
( |
) |
|
|
|
||
Changes in assets and liabilities: |
|
|
|
|
|
|
|
|
|
|||
Decrease (increase) in other current assets |
|
|
|
|
|
|
|
|
( |
) |
||
Increase (decrease) in other current liabilities |
|
|
|
|
|
( |
) |
|
|
|
||
Net cash provided by (used in) operating activities |
|
|
|
|
|
( |
) |
|
|
( |
) |
|
Cash flows from investing activities: |
|
|
|
|
|
|
|
|
|
|||
Repayments of loans to subsidiaries and other investees |
|
|
|
|
|
|
|
|
|
|||
Distribution from subsidiary |
|
|
|
|
|
|
|
|
|
|||
Net cash provided by investing activities |
|
|
|
|
|
|
|
|
|
|||
Cash flows from financing activities: |
|
|
|
|
|
|
|
|
|
|||
Common stock repurchased |
|
|
( |
) |
|
|
( |
) |
|
|
( |
) |
Dividends paid on common stock |
|
|
( |
) |
|
|
( |
) |
|
|
( |
) |
Dividends paid on redeemable preferred stock |
|
|
( |
) |
|
|
( |
) |
|
|
( |
) |
Loans from investees |
|
|
|
|
|
|
|
|
|
|||
Payment of Ares Put Option |
|
|
|
|
|
( |
) |
|
|
|
||
Repayment of long-term debt |
|
|
( |
) |
|
|
( |
) |
|
|
( |
) |
Net cash used in financing activities |
|
|
( |
) |
|
|
( |
) |
|
|
( |
) |
Net (decrease) increase in cash and cash equivalents and |
|
|
( |
) |
|
|
( |
) |
|
|
|
|
Cash and cash equivalents, beginning of year |
|
|
|
|
|
|
|
|
|
|||
Cash and cash equivalents, end of year |
|
$ |
|
|
$ |
|
|
$ |
|
|||
The accompanying notes are an integral part of the condensed financial statements.
F-53
SCHEDULE I
ARKO Corp. (Parent Company Only)
Condensed Statements of Cash Flows (cont’d)
(in thousands)
|
|
For the Year Ended December 31, |
|
|||||||||
|
|
2024 |
|
|
2023 |
|
|
2022 |
|
|||
Supplementary cash flow information: |
|
|
|
|
|
|
|
|
|
|||
Cash received for interest |
|
$ |
|
|
$ |
|
|
$ |
|
|||
Cash paid for interest |
|
|
|
|
|
|
|
|
|
|||
Cash paid for taxes |
|
|
|
|
|
|
|
|
|
|||
Supplementary noncash activities: |
|
|
|
|
|
|
|
|
|
|||
Prepaid insurance premiums financed through notes payable |
|
|
|
|
|
|
|
|
|
|||
Issuance of shares as payment of deferred consideration related to business |
|
|
|
|
|
|
|
|
|
|||
The accompanying notes are an integral part of the condensed financial statements.
F-54
ARKO Corp. (Parent Company Only)
Notes to Condensed Financial Statements
1. General
The condensed financial statements represent the financial information required by SEC Regulation S-X Rule 5-04 for ARKO Corp. (the “Company”), which requires the inclusion of parent company only financial statements if the restricted net assets of consolidated subsidiaries exceed 25% of total consolidated net assets as of the last day of its most recent fiscal year. As of December 31, 2024, the Company’s restricted net assets of its consolidated subsidiary, GPM Investments, LLC (“GPM”), were approximately $733.7 million and exceeded 25% of the Company’s total consolidated net assets. The primary restrictions as of December 31, 2024 were driven by GPM’s financing agreement with PNC which restrict the transfer of non-cash assets from GPM to the Company. This financing agreement also includes restrictions on distributions according to which, among other things, GPM’s ability to distribute is subject to certain conditions as defined in the underlying agreement. For more information about GPM’s financing agreement with PNC, refer to Note 12 to the consolidated financial statements.
2. Summary of Significant Accounting Policies
The accompanying condensed financial statements have been prepared to present the financial position, results of operations and cash flows of the Company on a stand-alone basis as a holding company. Investments in subsidiaries are accounted for using the equity method. The condensed parent company only financial statements should be read in conjunction with the Company's consolidated financial statements.
3. Long-Term Debt
Senior Notes
On October 21, 2021, the Company completed a private offering of $450 million aggregate principal amount of 5.125% Senior Notes due 2029 (the “Senior Notes”), pursuant to a note purchase agreement dated October 14, 2021, by and among the Company, certain of the Company’s wholly owned domestic subsidiaries (the “Guarantors”), and BofA Securities, Inc., as representative of the several initial purchasers named therein. The Senior Notes are guaranteed, on an unsecured senior basis, by all of the Guarantors. Refer to Note 12 to the consolidated financial statements for further details.
Insurance Premium Notes
The debt outstanding related to premium financing agreements are due within one year. Refer to Note 12 to the consolidated financial statements for further details.
F-55